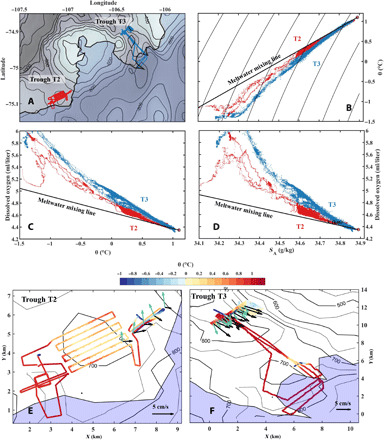
Fig. 2. Data from troughs T2 and T3 (Fig. 1).

(A) Mission tracks for both troughs. (B) Conservative temperature θ (in degrees Celsius) versus absolute salinity SA (in grams per kilogram), colors as in (A). Black contours are potential density. (C) Dissolved oxygen (in milliliters per liter) versus conservative temperature θ (in degrees Celsius). (D) Dissolved oxygen (in milliliters per liter) versus absolute salinity (in grams per kilogram). Black lines in (B) to (D) are the mixing lines between CDW (red circle) and glacial melt (see Methods) (16–18). (E and F) Conservative temperature θ (color bar) along the AUV track together with detided current velocity from the ship’s hull-mounted ADCP. Green arrows are average current velocity for a depth of 0 to 400 m, and black arrows are average current velocity for a depth of >400 m. For raw data, see fig. S5. Black arrow in lower right corner is scale arrow (5 cm/s). Ice shelf is indicated by blue transparent area, and depth contours are every 50 m. (E) Trough T2. (F) Trough T3. Note that most of the temperature variation in (E) and (F) are due to depth variations (see fig. S4 for depth and salinity along the AUV path)
