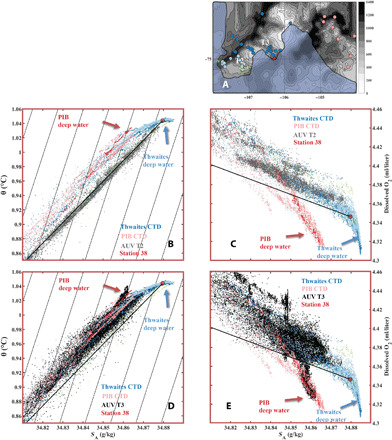
Fig. 4. Visualization of the deep water masses in the surveyed area.

Hydrographic data obtained by CTD [colors correspond to stations in (A)]. Pine Island Bay is indicated by PIB together with data obtained by the AUV. Solid black line shows the mixing line between CDW and ice shelf melt (see Methods) (16, 18, 40). (A) Map of the region. (B) Conservative temperature θ (in degrees Celsius) versus absolute salinity SA (in grams per kilogram) for CTD data and AUV data from trough T2 (gray) for the zoomed parameter space indicated by red box in Fig. 3D. Solid contours show the potential density. (C) Dissolved oxygen (in milliliters per liter) versus absolute salinity SA (in grams per kilogram) for CTD data and AUV data from trough T2 (gray) for the zoomed parameter space indicated by red box in Fig. 3E. (D) Conservative temperature θ (in degrees Celsius) versus absolute salinity SA (in grams per kilogram) for CTD data and AUV data from trough T3 (black) for the zoomed parameter space indicated by red box in Fig. 3D. Solid contours show the potential density. (E) Dissolved oxygen (in milliliters per liter) versus absolute salinity SA (in grams per kilogram) for CTD data and AUV data from trough T3 (black) for the zoomed parameter space indicated by red box in Fig. 3E. Blue and red arrows indicate the two deep water types discussed in the main text.
