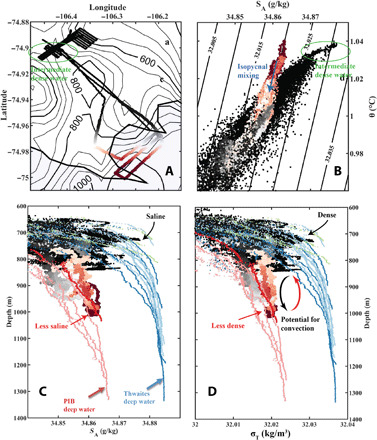
Fig. 5. Deep water underneath the ice shelf front is lighter than water outside the ice shelf.

(A) Map of trough T3 showing the AUV path color coded by latitude. Shaded region indicates the ice shelf front, and black contours are depth contours. (B) Conservative temperature θ (in degrees Celsius) versus absolute salinity SA (in grams per kilogram) for the AUV data points shown in (A), colors as in (A). Contours show potential density (9) relative to 900 m, and blue arrow indicates isopycnal mixing, i.e., water that has the same density but different temperatures and salinities. Green circles in (A) and (B) show the dense saline deep water found in trough T3 discussed in the main text. (C) Absolute salinity SA (in grams per kilogram) as a function of depth for the AUV data in trough T3 and the CTD data (colors indicate station as in Fig. 3). (D) Potential density (in kilograms per cubic meter) as a function of depth for the AUV data in trough T3 and the CTD data (colors indicate station as in Figs. 3 and 4). Red and blue arrows indicate the two deep water masses discussed in the main text from Pine Island Bay and Thwaites Trough. Dissolved oxygen versus θ and SA is shown in fig. S6.
