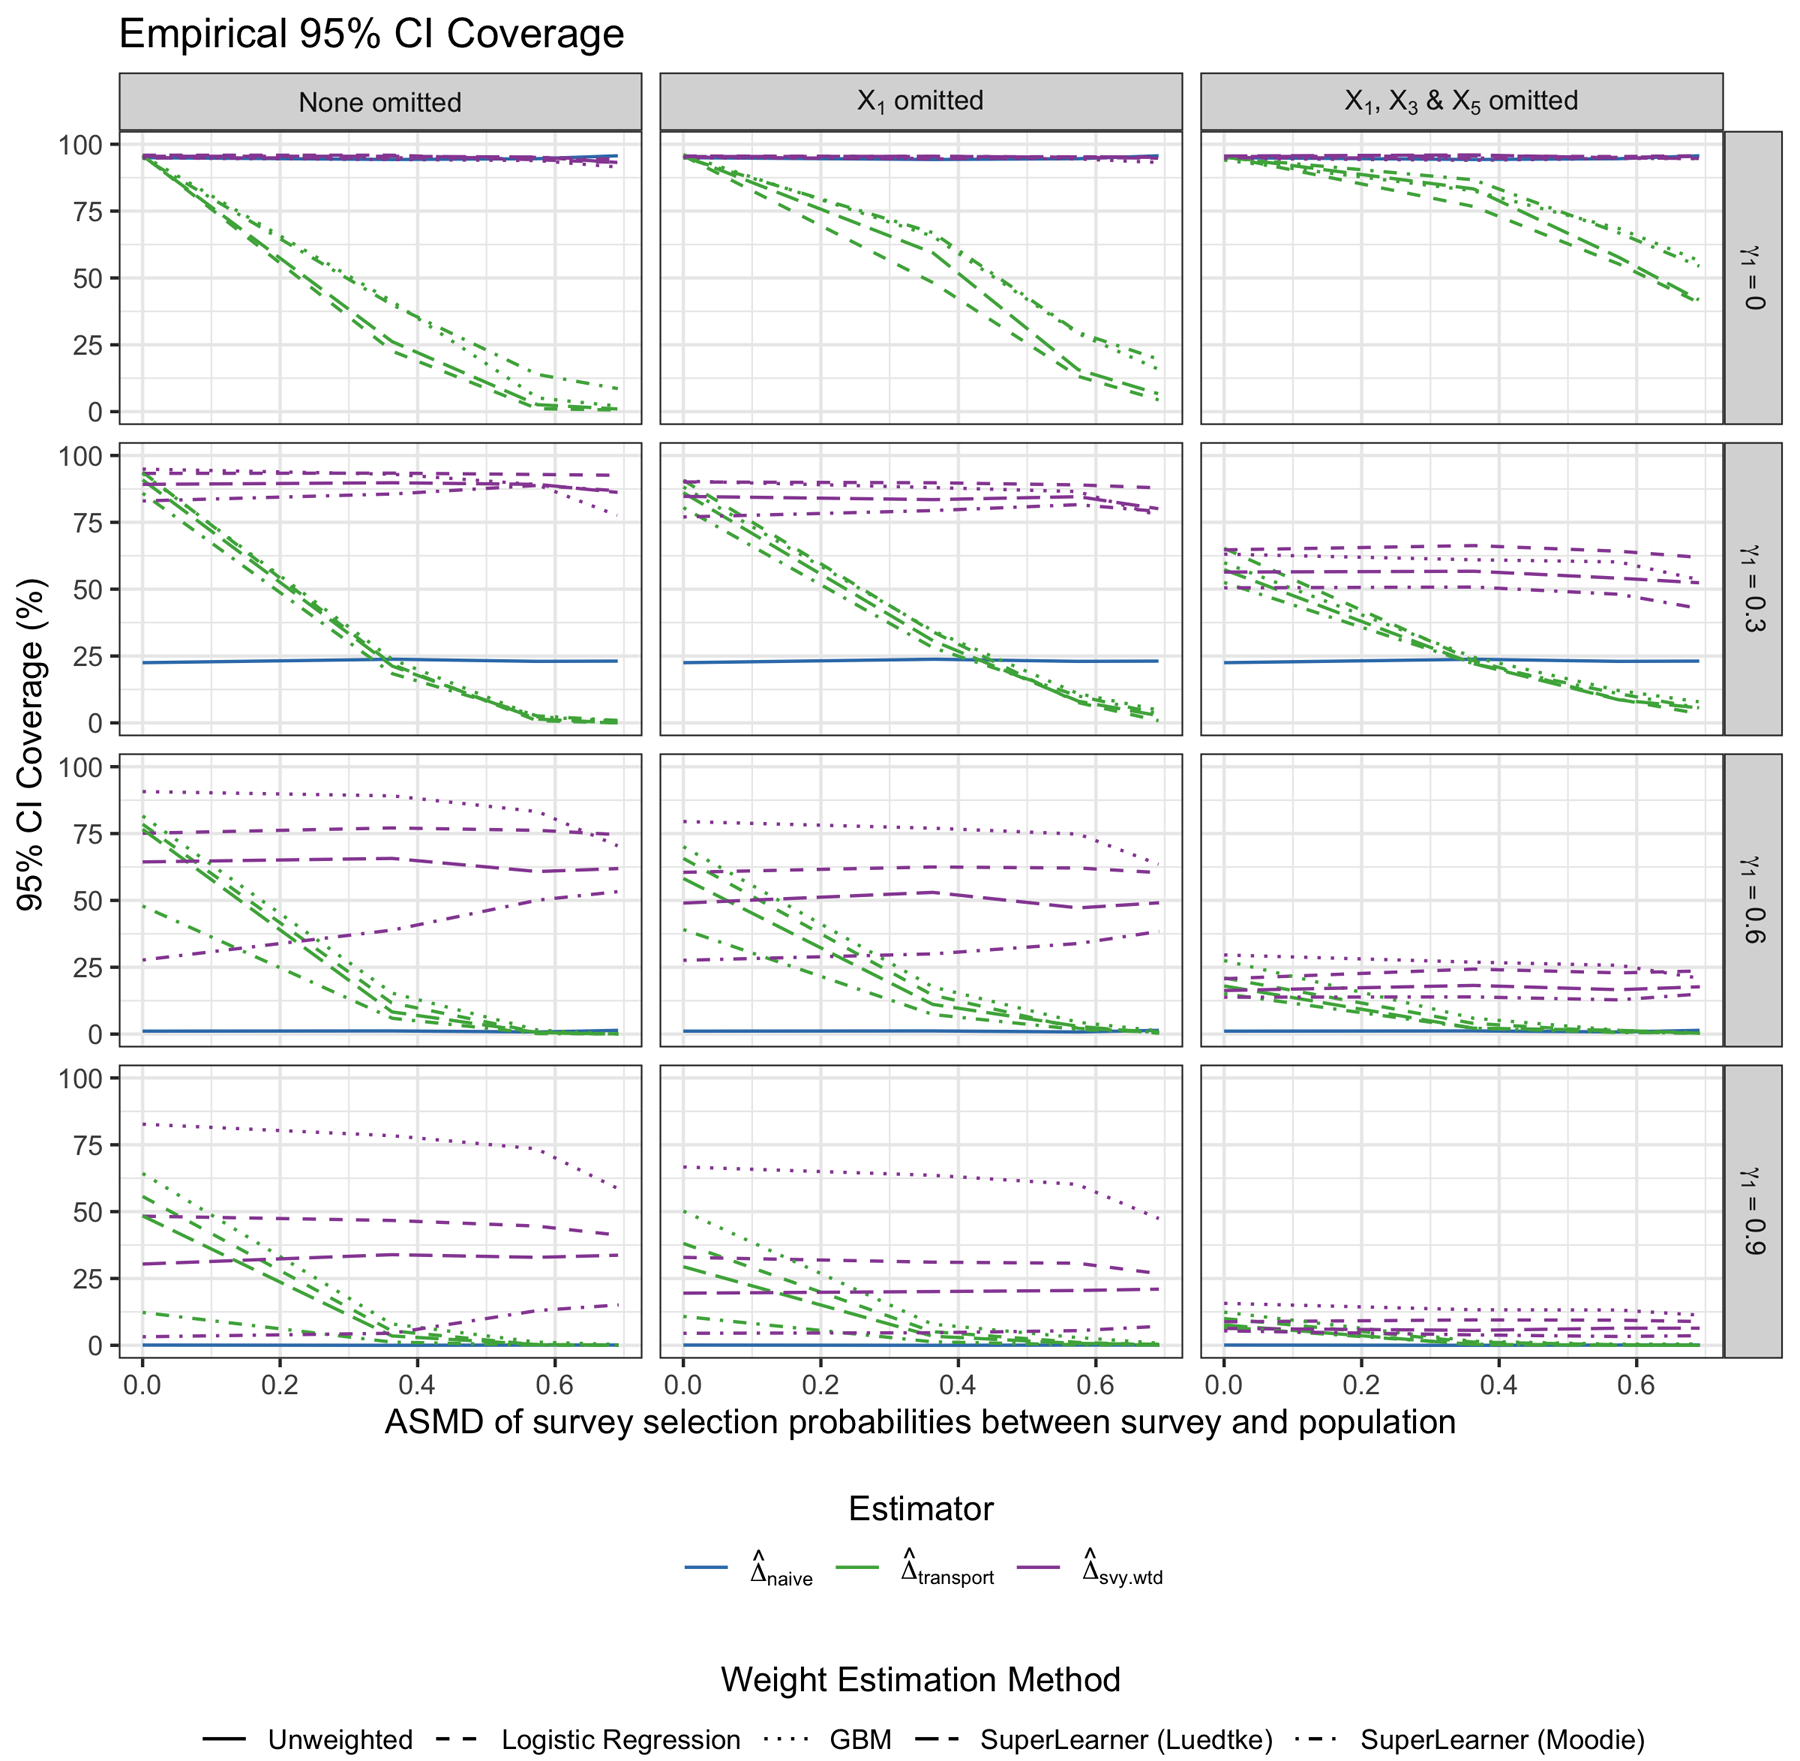
FIGURE 3.

Empirical 95% coverage of the PATE estimates by weighting method. Each column represents a different scenario of missing a variable used to calculate survey weights in the analytic survey dataset. From top to bottom row, the γ1 “scale” parameter for how much the trial differs from the population by the Xs increases. The different colors represent the different weighting approaches: Naive trial estimate (blue), transported estimate ignoring the survey weights (green), and transported estimate using the survey weights (purple). This figure appears in color in the electronic version of this article.
