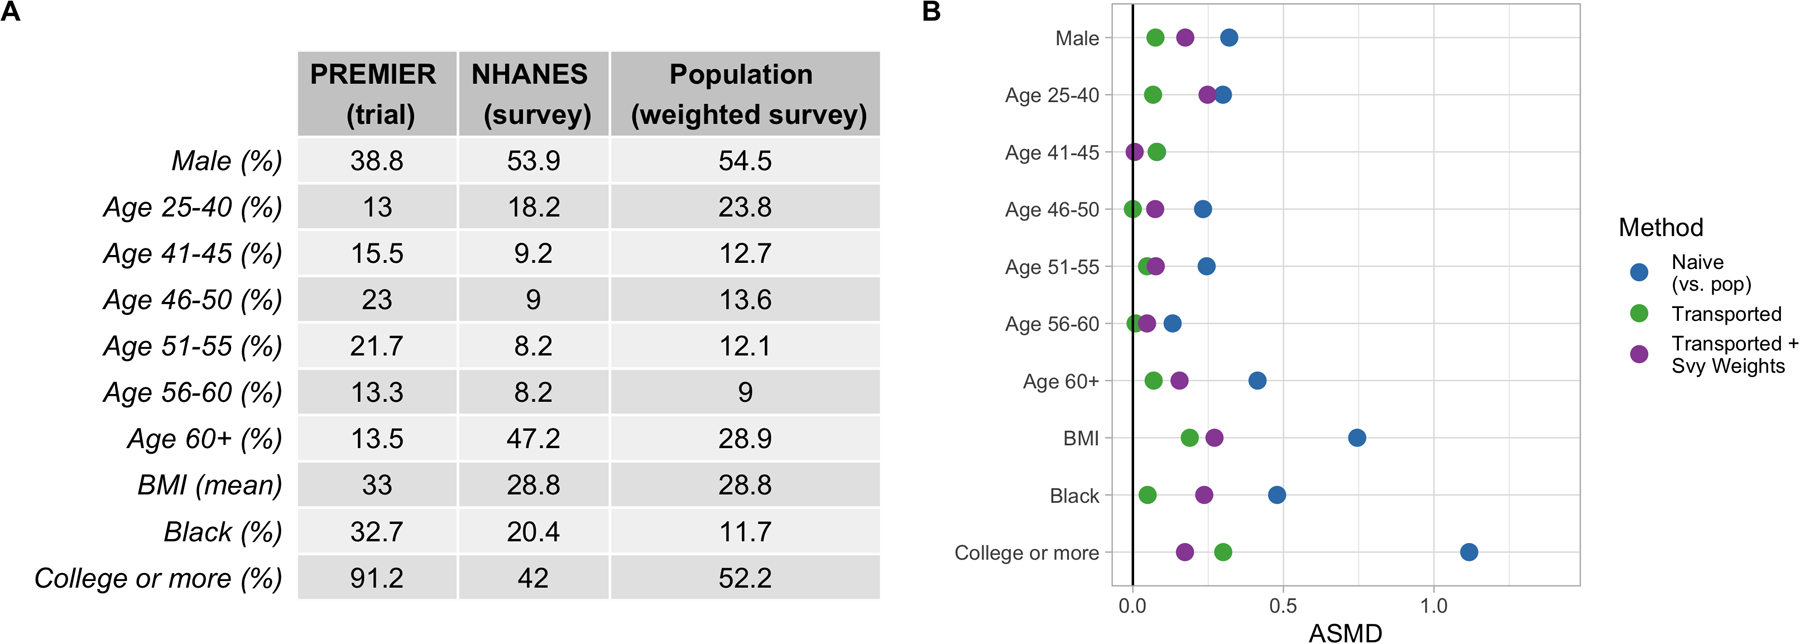
FIGURE 4.

A) Covariate Distributions in PREMIER (trial) and NHANES (survey sample), along with the weighted NHANES sample (target population). B) Absolute standardized mean difference (ASMD) of covariates between the trial and target population. Points in blue reflect covariate differences between the raw trial sample and the weighted survey sample (i.e. the target population demographics). Points in green show the differences between the transport-weighted trial and survey sample. Points in purple show the differences between the transport-weighted trial and population (where the trial is weighted to be more similar to the target population).
