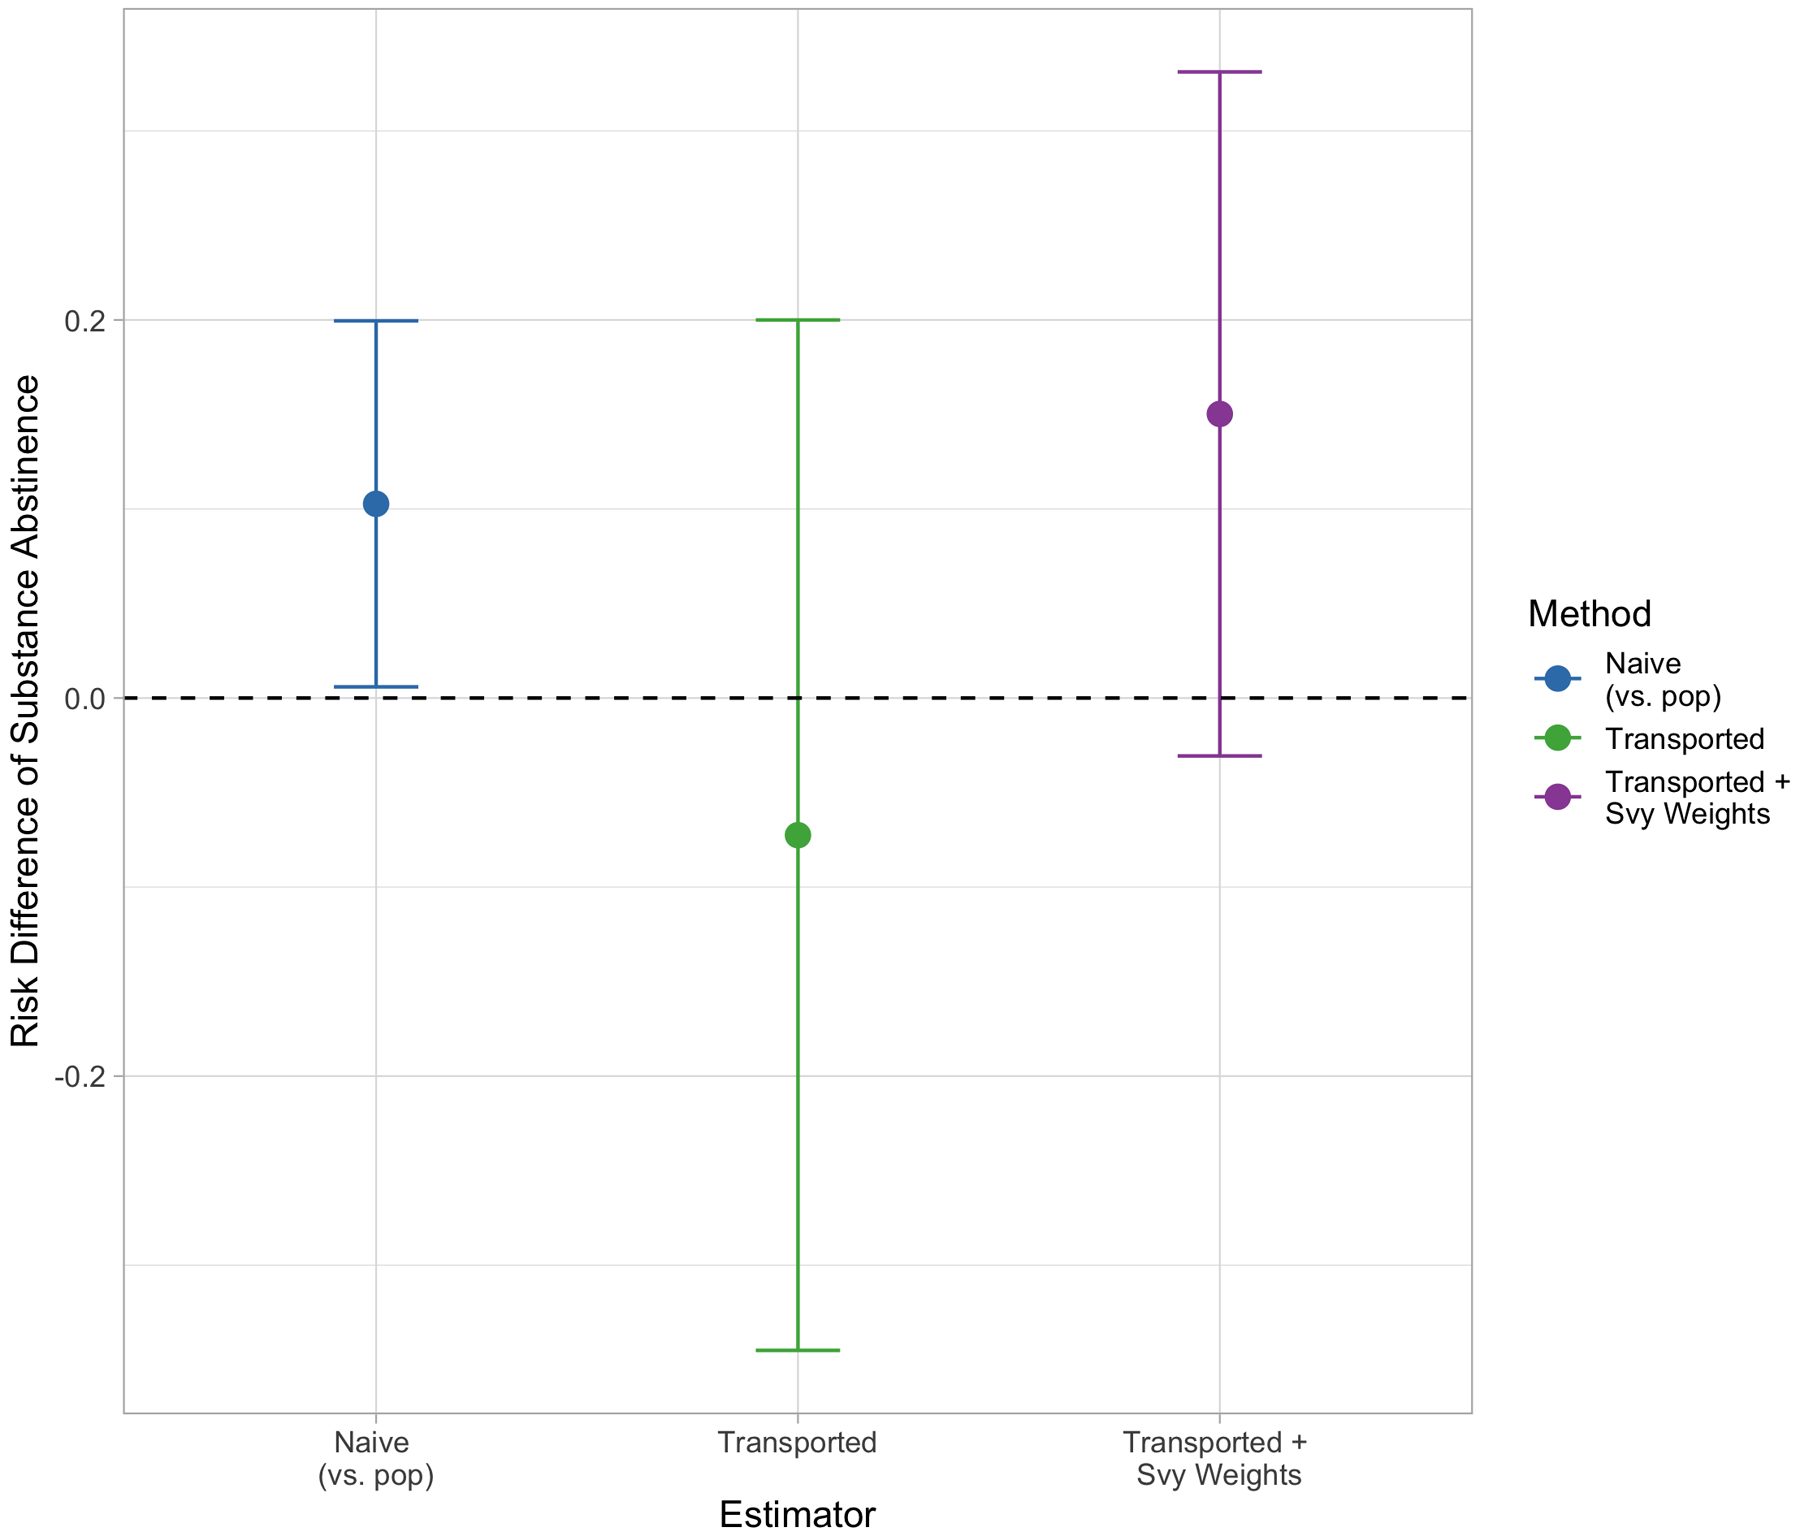
FIGURE 7.

Substance abstinence PATE estimates by transportability method. Points in blue reflect the naive PATE estimate, points in green show the transported PATE estimate ignoring survey weights. Points in purple show the survey-weighted transportability estimate.
