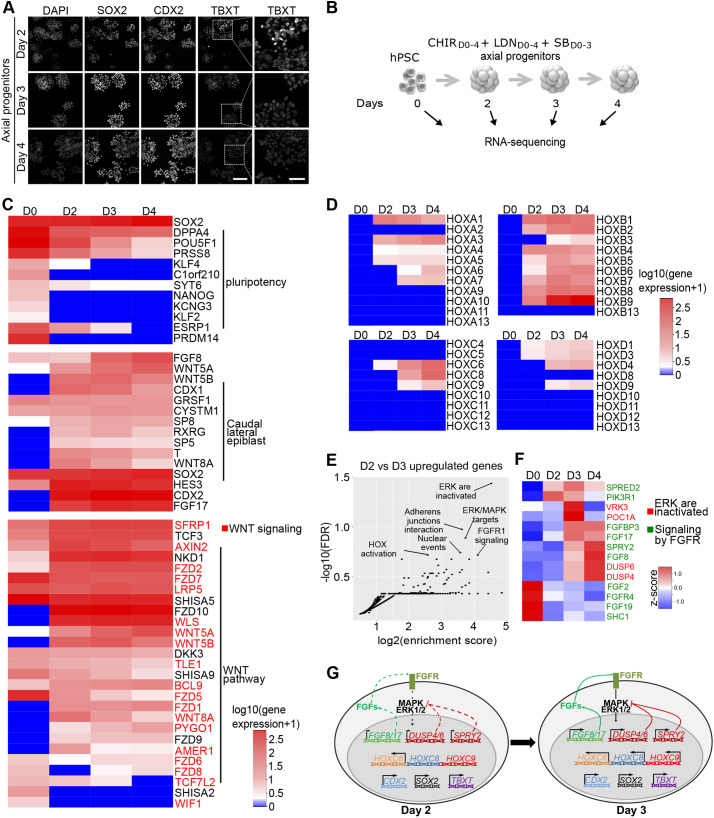
Fig. 2.
Temporal transcriptomic analysis of hPSC-derived axial progenitors. (A) Immunostaining for axial progenitor markers on hESC-derived progenitors at day 2, day 3 and day 4 of differentiation. Scale bars: 40 µm. (B) Experimental design of RNA-seq experiment to profile the transcriptome of hESC (SA001)-derived axial progenitors. n=2 per sample. (C) Heatmap of gene expression [log10(gene expression +1)] for pluripotency genes, most common mouse NMPs markers and Wnt pathway-related genes. Genes in red are part of the ‘Formation β-catenin:TCF transactivating complex' annotation found enriched in reactome pathway analysis in Fig. S3E,F. (D) Heatmap showing temporal transcriptional changes [log10(gene expression +1)] of all HOX genes. (E) Functional enrichment analysis (Reactome pathway) of the 232 genes upregulated twofold (P<0.05) between D3 and D2: y axis, FDR (false discovery rate); x-axis, enrichment score calculated for a given Reactome pathway. (F) Heatmap based on z-score of the genes associated with the annotations ‘ERK/MAPK target' (red labels) or ‘signaling by FGFR' (green labels) in reactome analysis in 2E. (G) Schematic representation of the transcriptional and immunostaining analysis of day 2 and day 3 progenitors.

