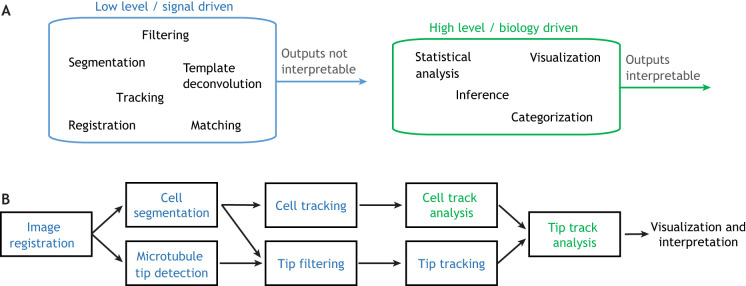
Fig. 2.
Hierarchy of image analysis tasks. (A) Image analysis pipelines can be decomposed into low-level (blue) and high-level (green) tasks, with low-level tasks generally preceding high-level tasks. (B) An example image-analysis pipeline for microtubule tracking with low-level tasks shown blue and high-level tasks shown green. Here, images are first registered, or aligned across frames, to account for microscope movement. Next, the cell is segmented, or distinguished from the background, and the microtubule tips are detected. The cell segmentation is used to filter tips by location, removing spurious detections outside the cell, and the cell segmentation and tip detections are separately tracked across frames. Finally, using information derived from a cell-tracking analysis, the tip tracks are analyzed to generate biological insight. In this example, only the track analyses are high-level tasks, since they are the only tasks whose outputs can be directly interpreted to gain biological insight.

