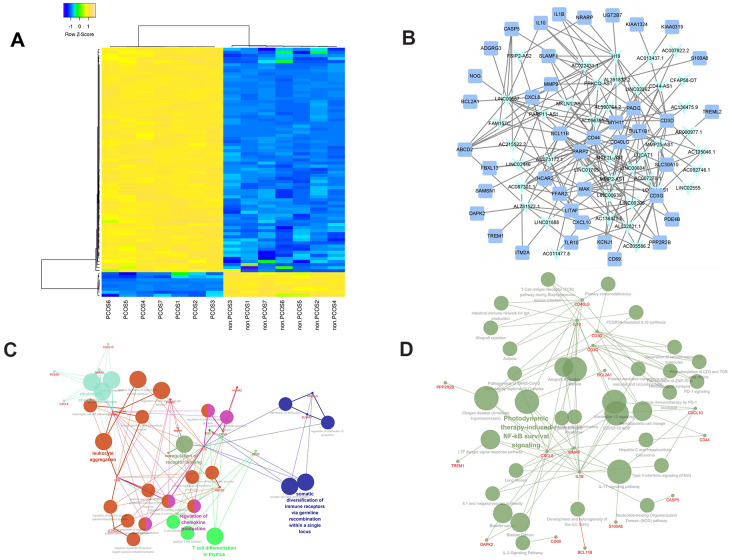
Figure 1.
Clustering and enrichment analysis of the PCOS-related lncRNA-mRNA network (PCLMN). (A) Unsupervised clustering of PCLMN genes. (B) PCLMN visualization. Light-blue arrowheads indicate lncRNAs and blue squares indicate mRNAs. Grey edges indicate lncRNA-mRNA interactions. (C) Network map of enriched GO terms in the PCLMN. (D) Network map of enriched KEGG pathways in the PCLMN.

