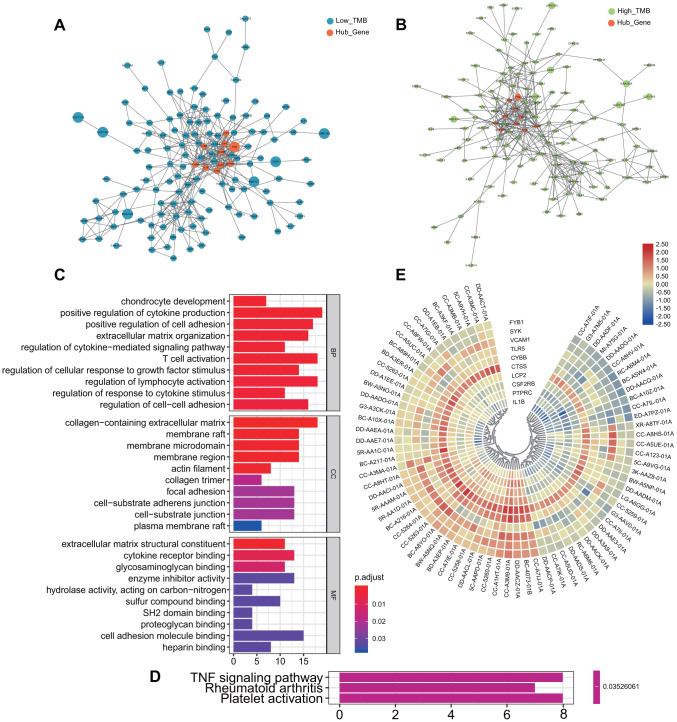
Figure 4.
Differentially expressed genes and functional enrichment analysis between the two groups. (A, B) Protein-protein interaction network of all Differentially expressed genes. Orange represents the screened hub genes, and the size of circle represents the level of gene expression. (C) Go enrichment analysis of all differentially expressed genes. (D) KEGG analysis of all differentially expressed genes: TNF signaling pathway, Rheumatoid arthritis and Platelet activation. (E) Heatmap of selected hub genes in each patient. From left to right in order of low TMB and high TMB group. MF, Molecular Function; BP, Biological Process; CC, Cellular Component; GO, Gene Ontology; KEGG, Kyoto Encyclopedia of Genes and Genomes.

