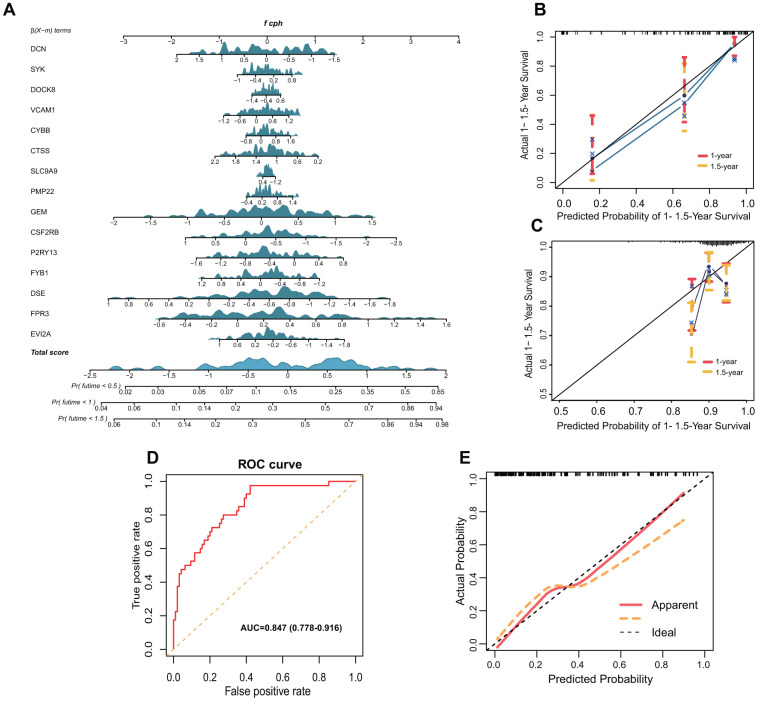
Figure 7.
Nomogram and validation of TMB-IF prognostic panel. (A) Nomogram of all genes that presented significance for prognosis. (B) Internal calibration curve of the TMB-IF panel. Red points correspond to the fitting degree of 1-year survival probability, and the orange points correspond to the fitting degree of 1.5-year survival probability. (C) Calibration curve of 203 patients in ICGC database. (D) ROC curve was utilized to evaluate the potential flexibility of TMB-IF in GSE20017. ROC, Receiver operating characteristic. (E) Calibration curve of TMB-IF in predicting tumor vascular invasion.

