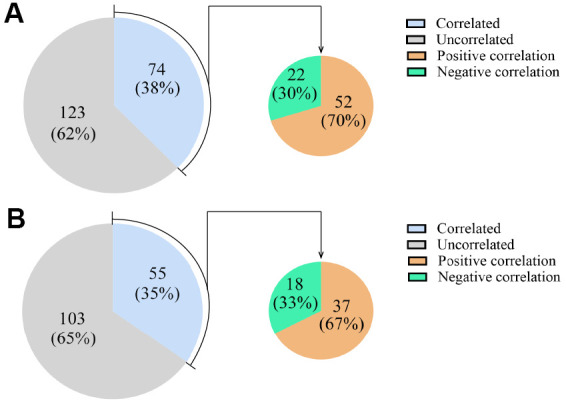
Figure 5.

Expression correlations between DEcircRNAs/DElncRNAs and their host mRNAs. (A) The expression correlations between DEcircRNAs and their host mRNAs. (B) The expression correlations between DElncRNAs and their host mRNAs. The blue area represents the DEcircRNAs/DElncRNAs that correlated with their host mRNAs as a percentage of all the DEcircRNAs/DElncRNAs. The gray area represents the remaining DEcircRNAs/DElncRNAs. The orange area represents the DEcircRNAs/DElncRNAs that correlated positively with their host mRNAs, and the green area represents the DEcircRNAs/DElncRNAs that correlated negatively with their host mRNAs, as percentages of the DEcircRNAs/DElncRNAs that correlated with their host mRNAs.
