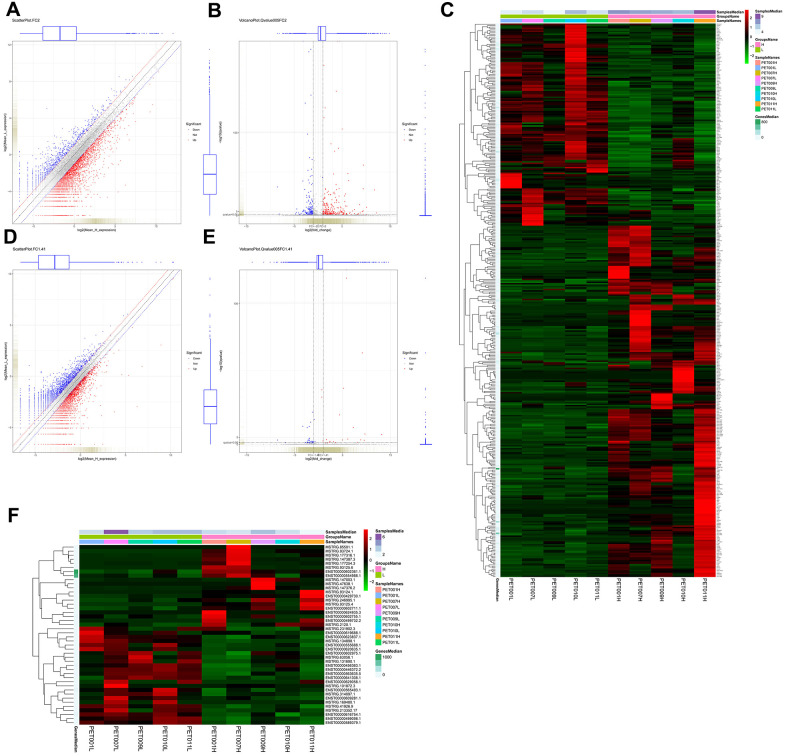
Figure 1.
Identification and hierarchical clustering analysis of differentially expressed mRNAs and lncRNAs between lung tissue samples with high metabolic activity (PET-high) and lung tissue samples with low metabolic activity (PET-low). (A) scatter plot of mRNAs with |log2 fold change (FC) | > 1; (B) volcano plot of mRNAs with |log2FC | > 1 (FC > 2) and q value < 0.05; (C) Hierarchical clustering heatmap of differentially expressed mRNAs; (D) scatter plot of lncRNAs with |log2 FC | > 0.5 (FC > 1.41); (E) volcano plot of lncRNAs with |log2 FC | > 0.5 and q value < 0.05; (F) hierarchical clustering heatmap of differentially expressed lncRNAs.

