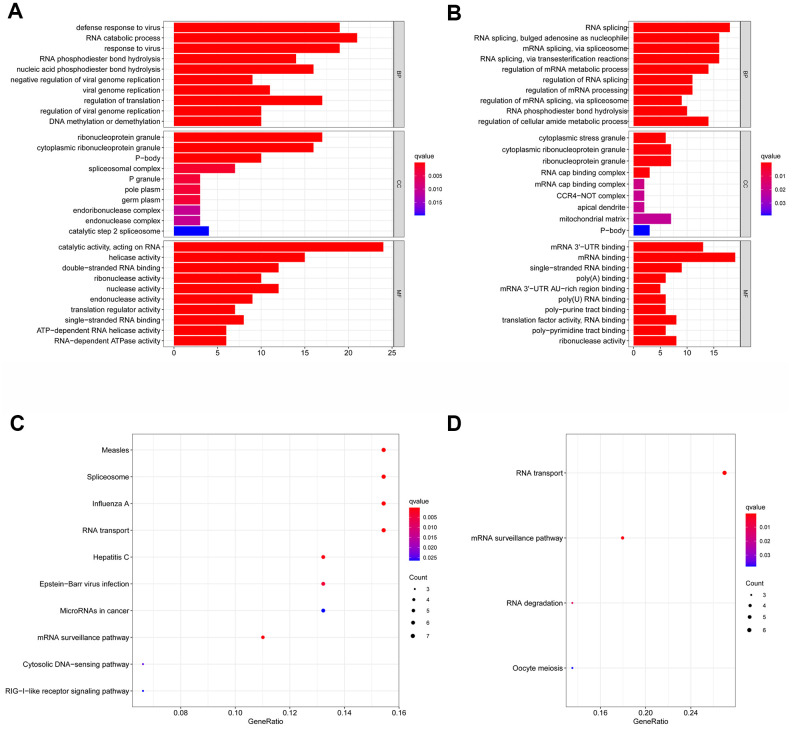
Figure 3.
Gene ontology (GO) and kyoto encyclopedia of genes and genomes (KEGG) analysis of the differentially expressed RBPs. Results of GO functional annotation analysis of up (A) and down (B) regulated differentially expressed RBPs; Results of KEGG pathways enrichment analyses of up (C) and down (D) regulated differentially expressed RBPs. The dot size represents the enriched gene number.

