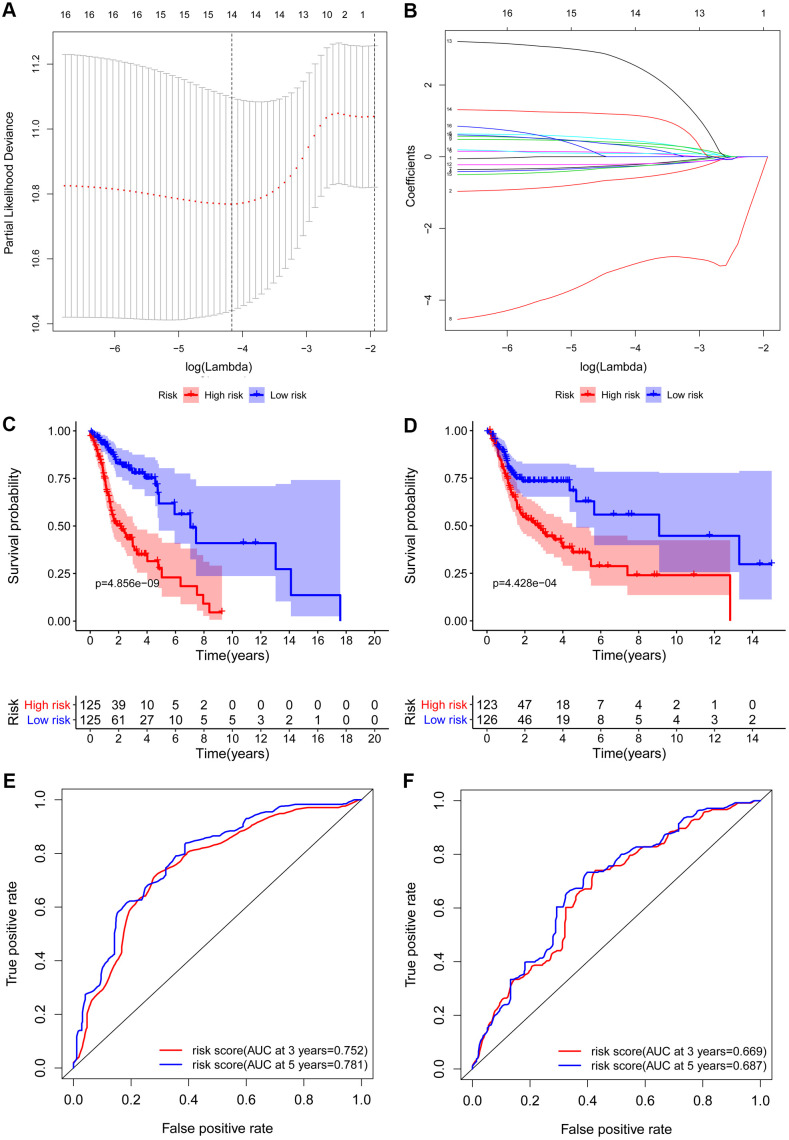
Figure 5.
Construction and validation of the prognostic risk model in HNSCC patients. (A) Screening of optimal parameter (lambda) at which the dotted vertical lines were drawn. (B) Lasso coefficient profiles of the candidate RBPs with non-zero coefficients determined by the optimal lambda. Kaplan-Meier plot of the high-risk (red) and low-risk (blue) HNSCC patients in the training group (C) and testing group (D). The 3-year (red) and 5-year (blue) ROC curves in the training group (E) and testing group (F) of HNSCC patients.

