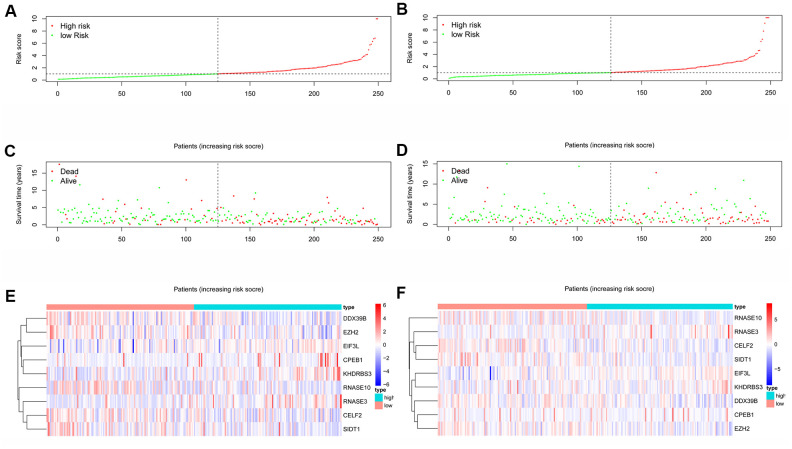
Figure 6.
RBPs-related prognostic characteristics in patients with HNSCC. Risk score distribution of HNSCC patients with different risks in the training group (A) and testing group (B) (low, green; high, red). Dot plots showing the survival time and risk score in training group (C) and testing group (D). The heatmap of the 9 key genes expression profiles in the training group (E) and testing group (F) (low, blue; high, red).

