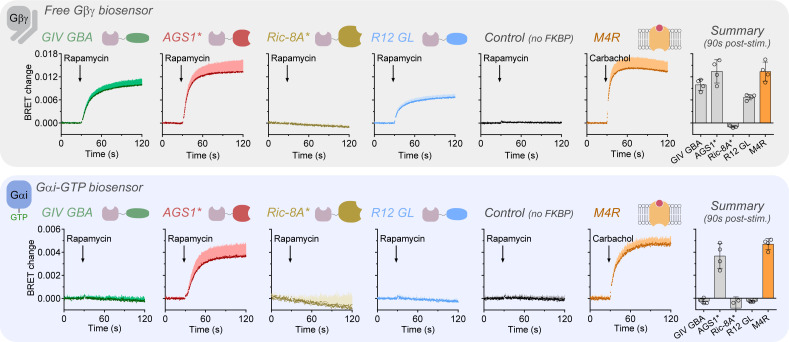
Figure 2. Non-receptor guanine nucleotide exchange factors (GEFs) display different abilities to promote Gα-GTP and/or free Gβγ formation.
HEK293T cells expressing the components of the bioluminescence resonance energy transfer (BRET) biosensor for free Gβγ (top) or Gαi-GTP (bottom), the membrane-anchored FRB construct, and the indicated FKBP-fused G-protein regulators GIV GBA, AGS1*, Ric-8A*, or R12 GL were stimulated with rapamycin (0.5 μM) at the indicated time during kinetic BRET measurements. Stimulation of ectopically expressed M4 muscarinic receptor (M4R) with carbachol (100 μM) was done as a reference condition, and rapamycin stimulation of cells not expressing FKBP-fused constructs was done as a negative control. Bar graphs on the right summarize the BRET changes 90 s after addition of rapamycin or carbachol. Mean ± SD, n = 3–4. In the kinetic traces, the SD is displayed as bars of lighter color tone than data points and only in the positive direction for clarity.


