. 2021 Mar 25;10:e66079. doi: 10.7554/eLife.66079

Figure 2. BioID2 identifies changes in membrane protein levels during heart regeneration.

(A) Schematic overview of experimental workflow. cmlc2:birA2-GFP or cmlc2:bira2-GFP-CAAX ventricles were collected as uninjured samples or 14 days after induced cardiomyocyte ablation (dpi). (B) Timeline of injury and biotin injections. (C) Venn diagram comparing proteins captured by either the whole-cell BioID2 assay or the membrane BioID2 data set that display at least a 1.5-fold change. (D) Summary of BioID2 analysis of cmlc2:birA2-GFP hearts during regeneration. Left: heat map of proteins found in triplicates of quantitative mass spectrometry analysis. 208 proteins displayed a 1.5-fold change during regeneration when compared to uninjured hearts (p<0.05). Of these, most protein levels increase during heart regeneration. Protein level changes in log10 scale. Right: gene ontology analysis of BirA2-GFP BioID2 data set. Over-representation test of biological processes for at least 1.5-fold increased (yellow) and at least 1.5-fold decreased proteins (blue). Fold enrichment is shown, and protein number is indicated in red. p<0.001, FDR < 0.04%. (E) Summary of BioID2 on cmlc2:bira2-GFP-CAAX hearts. Left: heat map of proteins found in triplicates of quantitative mass spectrometry analysis. 173 proteins displayed an at least 1.5-fold change when compared to uninjured hearts (p<0.05). Of these, most proteins decreased at the membrane during heart regeneration. Right: gene ontology analysis of BirA2-GFP-CAAX BioID2 data set. p<0.001, FDR < 0.05%. (F) Heat map of proteins that have been identified in the BioID2 whole-cell and membrane data sets and that display opposing changes in levels. Those shown changed at least 1.5-fold, p<0.05. Heat map summarizes fold changes measured in three separate pooled samples. (G) Immunofluorescence against indicated proteins in ventricles. Epb41l5 is localized to the plasma membrane (marked by wheat germ agglutinin [WGA] staining) in uninjured hearts, with cytoplasmic fluorescence signals increasing during regeneration of resected tissue (14 days post amputation [dpa]). (H) Seta is poorly detected in uninjured hearts, rising 7 days after resection injury in the epicardium and compact layer of the heart. Seta localizes around the nucleus and colocalizes with the membrane marker WGA. Scale bar in images, 50 μm; magnification scale bar: 10 μm.

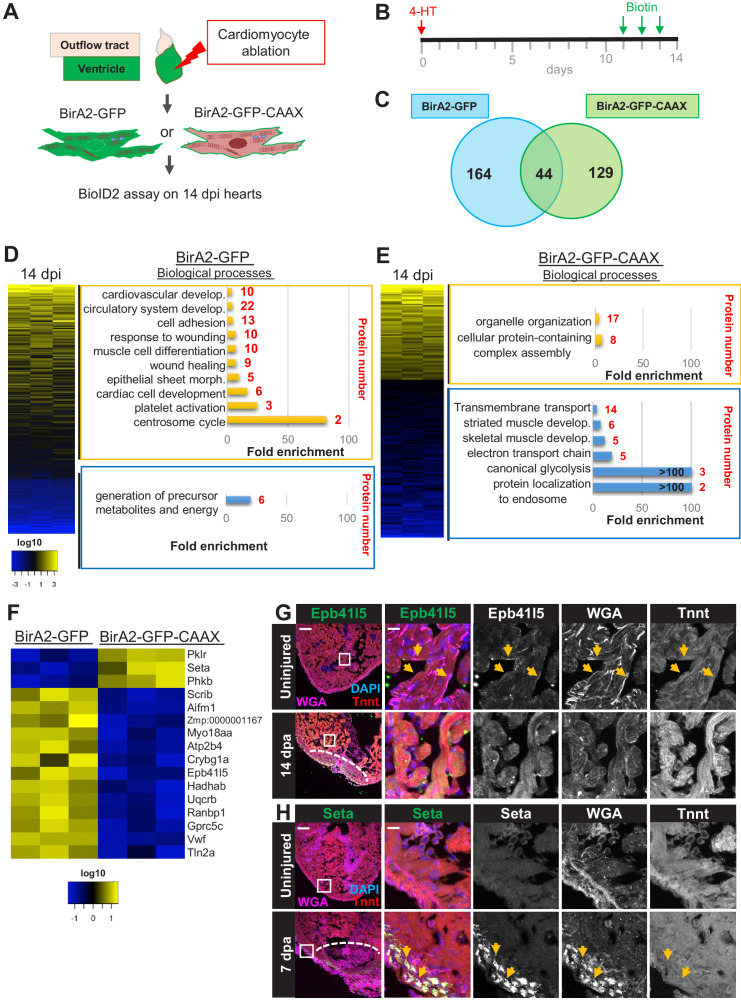
Figure 2.

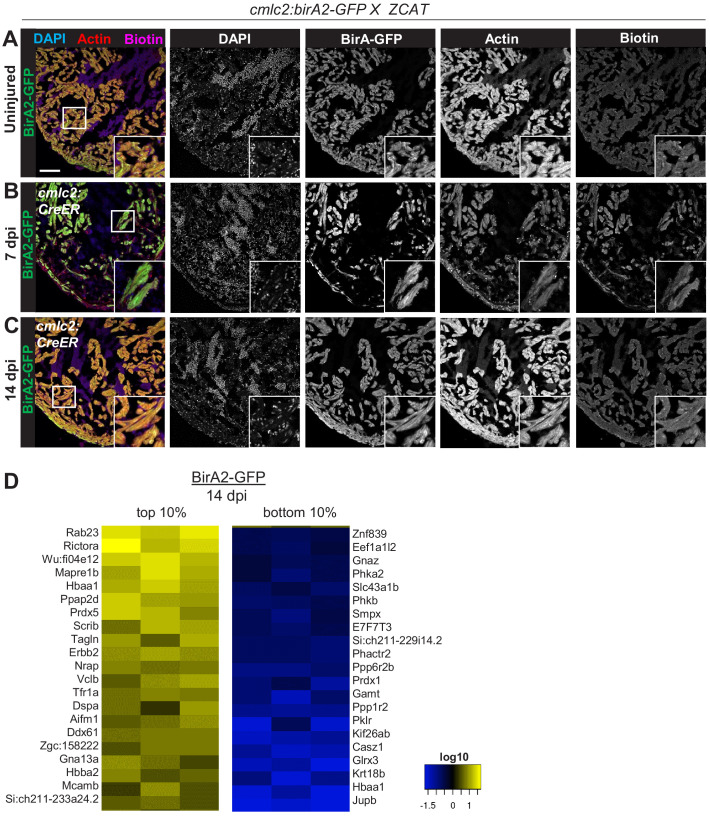
Figure 2—figure supplement 1. Cardiomyocyte ablation in cmlc2:birA2-GFP fish, and summary of proteins that display largest changes in levels.

Figure 2—figure supplement 1.

(A–C) Immunofluorescence images of sections of ventricles of fish expressing BirA2-GFP crossed to the Z-CAT cardiomyocyte ablation model (Wang et al., 2011). Animals were treated with 4-HT to induce expression of diphtheria toxin (DTA) toxin. Ventricles were stained for DAPI, actin, and biotin. Scale bar: 50 µm. (D) Top 10% and bottom 10% of proteins that were captured in the whole-cell BioID2 assay and show the largest changes in levels after injury in BirA2-GFP; Z-CAT fish. Heat map summarizes fold changes measured in three separate pooled samples.
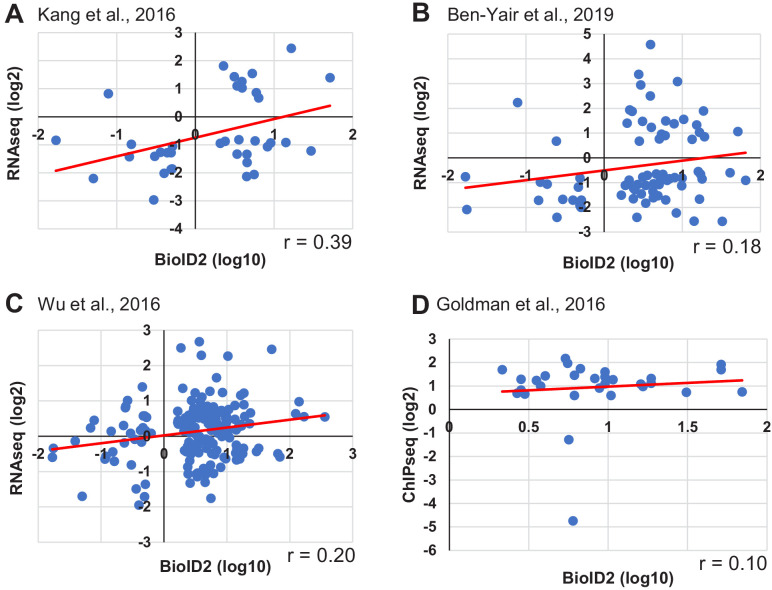
Figure 2—figure supplement 2. Comparison of the BioID2 data set with published transcriptome or epigenome data sets.

Figure 2—figure supplement 2.

(A–D) The 14 days post incubation (dpi) BirA2-GFP BioID2 data set (normalized to uninjured, p<0.05) was compared to three RNA-seq data sets (Wu et al., 2016; Kang et al., 2016; Ben-Yair et al., 2019) and one ChIP-seq (H3.3) data set (Goldman et al., 2017). For RNA-seq data sets (A–C), expression levels have been normalized to uninjured controls and genes with differences of significance p<0.05 were considered. (A) RNA-seq data set from Kang et al., 2016, where 14 dpi whole hearts were used. 37 genes were identified in both data sets, with a correlation coefficient r = 0.39. (B) RNA-seq data set from Ben-Yair et al., 2019, in which purified gata4-expressing cells were examined for transcriptome changes at 5 dpa. 75 genes were represented in both data sets, with a correlation coefficient r = 0.18. (C) RNA-seq data set from Wu et al., 2016, where 7 days post cryoinjury whole hearts (border zone) were used. 160 genes were identified among both data sets, with a correlation coefficient r = 0.2. (D) ChIP-seq data set from Goldman et al., 2017, in which genes with changes in enrichment for a cardiomyocyte-restricted, tagged H3.3 protein at promoters were used in comparison. Promoters were defined as between 5 kb upstream and 2 kb downstream from the gene start site. FDR < 0.05 for significant differential sites, and p<0.05. 30 genes were identified among both data sets.
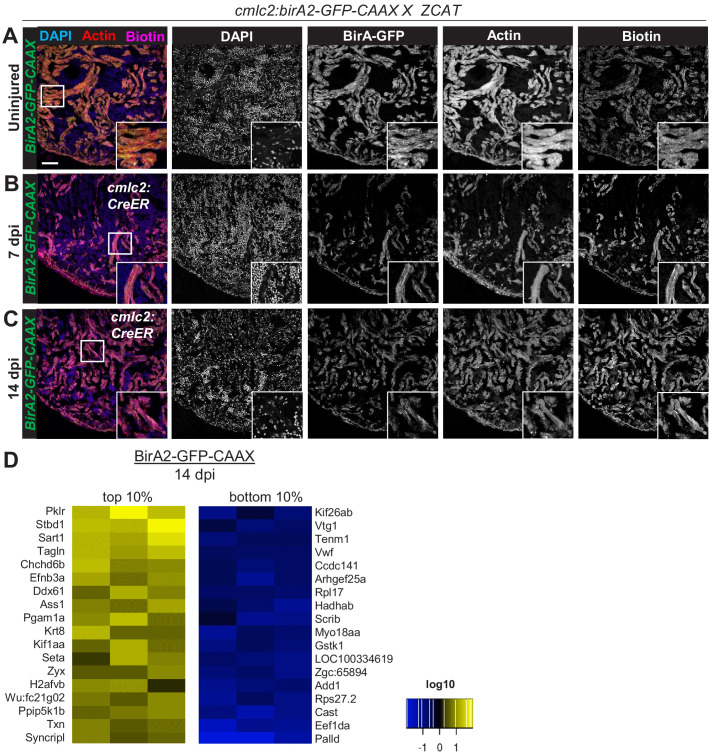
Figure 2—figure supplement 3. Cardiomyocyte ablation in cmlc2:bira2-GFP-CAAX fish, and summary of proteins that display largest changes levels.

Figure 2—figure supplement 3.

(A–C) Immunofluorescence images of sections of ventricles of fish expressing BirA2-GFP-CAAX crossed to the Z-CAT ablation model (Wang et al., 2011). Animals were treated with tamoxifen to induce expression of DTA toxin. Ventricles were stained for DAPI, actin, and biotin. Scale bar: 50 µm. (D) Top 10% and bottom 10% of proteins that were captured in the whole-cell BioID2 assay and show the largest changes in levels after injury. Heat map summarizes fold changes measured in three separate pooled samples.
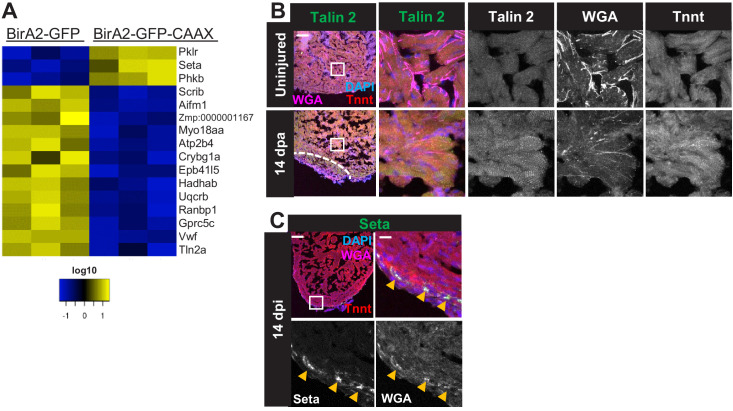
Figure 2—figure supplement 4. Protein levels and localization from BioID2 comparison of whole cardiomyocytes and membranes.

Figure 2—figure supplement 4.

(A) Heat map of proteins identified in the BioID2 whole-cell and membrane data sets that display opposing changes in levels. Changes 1.5-fold or greater with p<0.05. Log10 scale is used. Heat map summarizes fold changes measured in three separate pooled samples. (B,C) Immunofluorescence for indicated proteins in ventricular sections. (B) Talin 2 levels are low and display a punctate distribution in the uninjured heart. During regeneration, Talin levels rise in the cytoplasm. (C) Seta-positive cells are localized to the compact layer and epicardium in 14 days post incubation hearts injured by the Z-CAT ablation model. Scale bars: 50 μm; magnification scale bar: 10 μm.