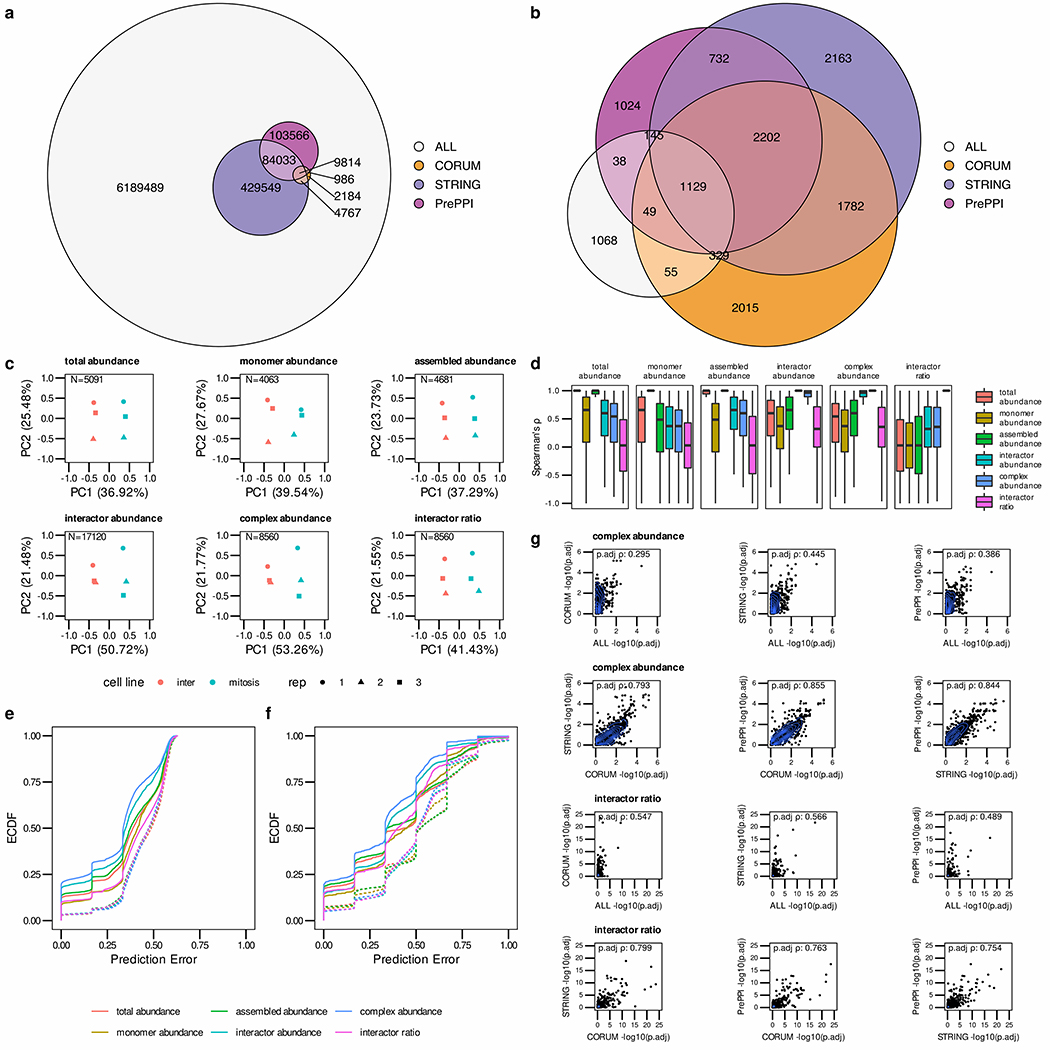
Figure 3.
PPI quantification and Network integration assessment using the HeLa-CC (Heusel et al., 2020) dataset. (a) The Euler diagram indicates the overlap of STRING, PrePPI and CORUM reference PPI networks resulting in at least a partial overlap of the interactors in any of the replicates. (b) Overlap of confident (q-value < 0.05) PPI detections after SECAT analysis with different reference PPI networks. (c) Quantitative SECAT metrics can be used to separate experimental conditions and replicates. (d) The distributions of Spearman’s rank correlation coefficient (Spearman’s ρ) of the metrics (PPI: summarized by averaging) in reference to the other levels are depicted in individual boxplots (lower and upper hinges represent the first and third quartiles; the bar represents the median; lower and upper whisker extend to 1.5 * IQR from the hinge). (e) Predictive error quantified by the empirical cumulative distribution function (ECDF) for leave-one-out cross-validated logistic regression classification of replicates to biological conditions. (f) Predictive error for group-wise leave-one-out cross-validated logistic regression classification of replicates to biological conditions. Groups represent several metrics connected to a core metric based on the PPI network. (g) Correlation of node-level integrated adjusted p-values estimated using different reference PPI networks.

