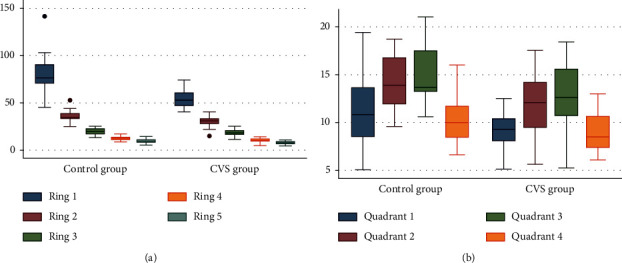
Figure 1.

mfERG subgroup outcomes. (a) Plot showing the main differences in mfERG Rings P1 amplitudes between the control and the CVS groups. (b) Plot showing the main differences in mfERG Quadrants P1 amplitudes between the control and the CVS groups.
