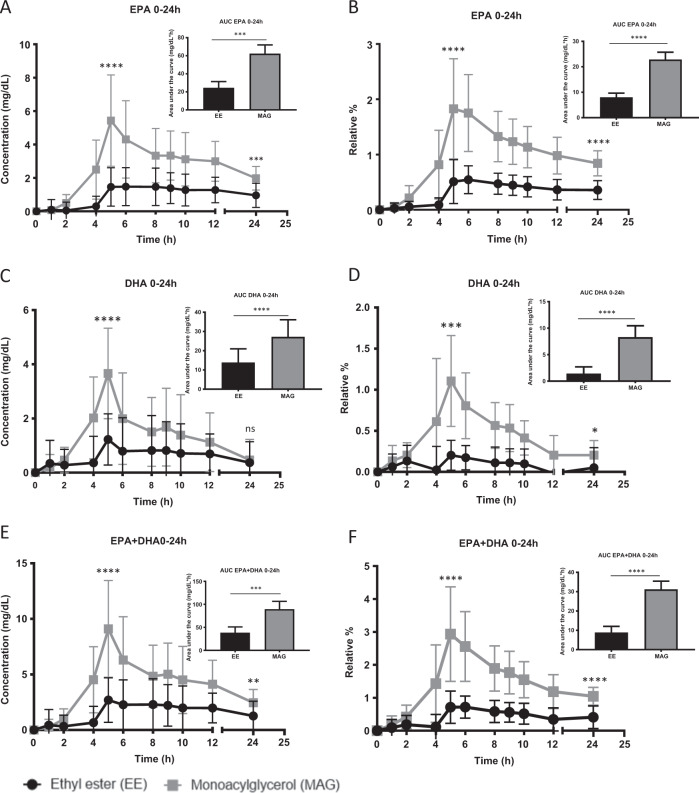
Fig. 2. Pharmacokinetics of eicosapentaenoic acid and docosahexaenoic acid with monoacylglyceride (gray) or ethyl ester (black) supplement.
a Concentration (mg/dL) of plasma eicosapentaenoic acid (EPA) in total lipids over 24 h; b Relative % of plasma EPA in total lipids over 24 h; c Concentration (mg/dL) of plasma docosahexaenoic acid (DHA) in total lipids over 24 h; d Relative % of plasma DHA in total lipids over 24 h; e Concentration (mg/dL) of plasma EPA + DHA in total lipids over 24 h; f Relative % of plasma EPA + DHA in total lipids over 24 h. All results are expressed as mean ± SD (n = 20). AUC = area under the curve. ns p value > 0.05 (t-test), *p value = 0.0136 (t-test), **p value = 0.005 (Wilcoxon test), ***p value < 0.001 (Wilcoxon test), ****p value < 0.0001 (t-test).

