Fig. 3.

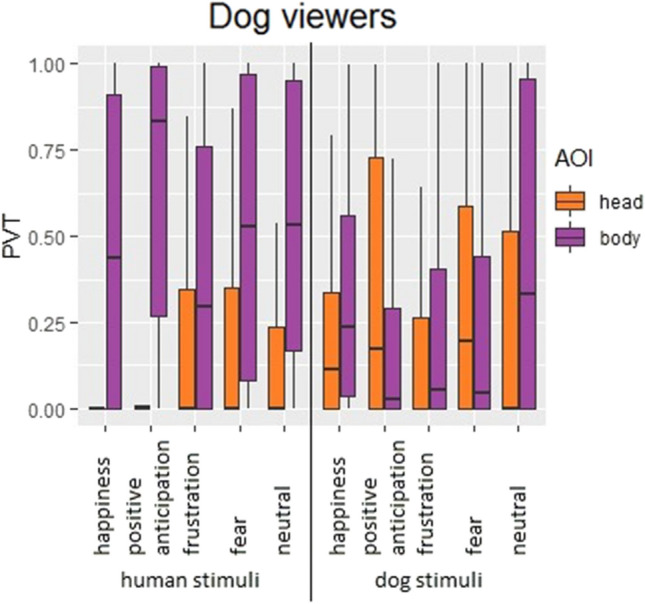
Boxplot with distribution of proportion of viewing time (PVT) in dog viewers, by Area of Interest (AOI), viewed expression, and viewed species. Whiskers represent minimum and maximum, box includes median and interquartile range

Boxplot with distribution of proportion of viewing time (PVT) in dog viewers, by Area of Interest (AOI), viewed expression, and viewed species. Whiskers represent minimum and maximum, box includes median and interquartile range