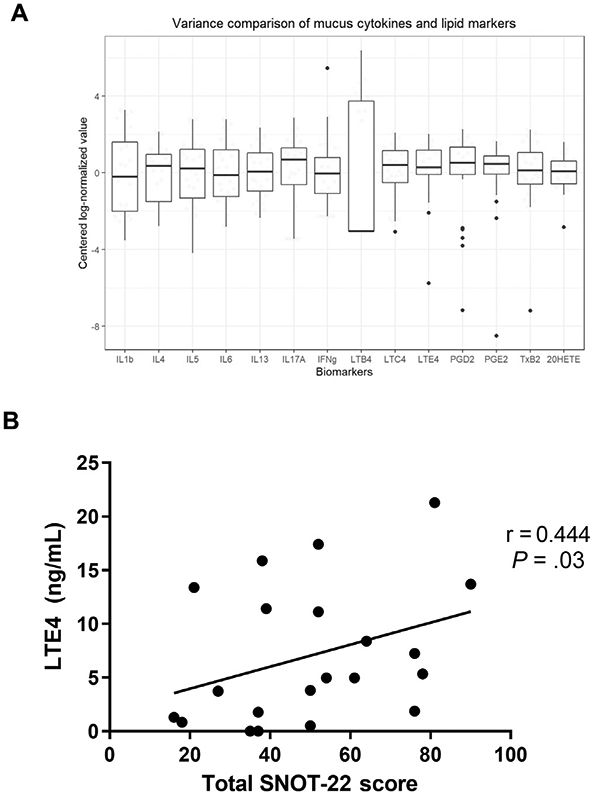
FIG 3.

A, Variance comparison for cytokines and lipid mediators. Log-normalized and centered raw cytokine and lipid mediator values are visualized using boxplots for a graphical comparison of the relative variability of each biomarker. Values are expressed as the median with interquartile range. Omnibus testing between biomarkers using the coefficient of variation showed statistically significant differences (P < .001) between groups. Note the relatively lower variance in lipid mediators compared with cytokines. B, The correlation of mucus leukotriene E4 (LTE4) levels with total SNOT-22 score evaluated using Spearman correlation.
