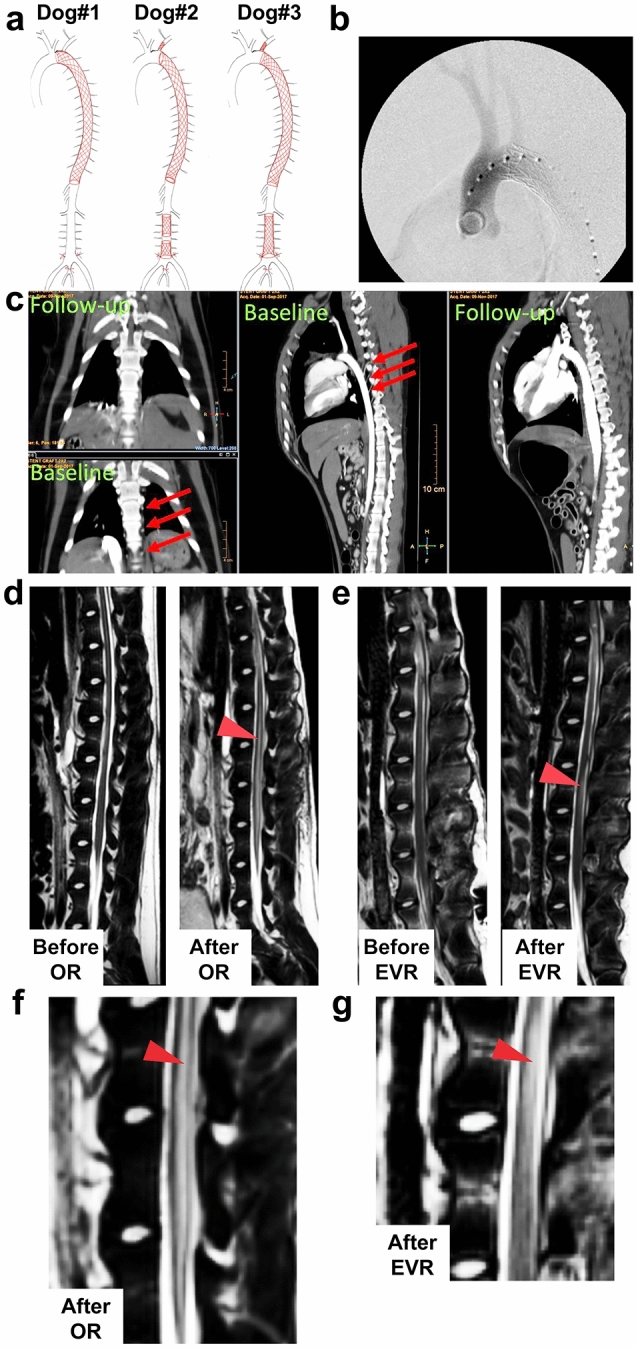
Figure 1.

EVR and OR give different signals in MRI. (a) Drawing showing the extent of arterial occlusion in EVR dogs #1–3 as indicated. (b) X-ray images showing the stent inside the aorta of dog#1. (c) CTA image showing frontal (two left panels) and lateral (two right panels) views of EVR dog#3 before (baseline) and after (day 2) occlusion following EVR. Arrows point at segmental arteries before aortic stenting. (d) Sagittal T2-weighted MRI images: left, before OR surgery, showing no signal; right, after OR, showing abnormal signal centrally within the cord involving grey matter (arrowhead). (e) Sagittal T2-weighted MRI images of EVR dog#3: left, before EVR surgery, showing no signal; right, after EVR, showing abnormal signal within the posterior aspect of the cord at L3 involving white matter (arrowhead). (f), (g) Enlargements from right panels in (d) and (e), respectively.
