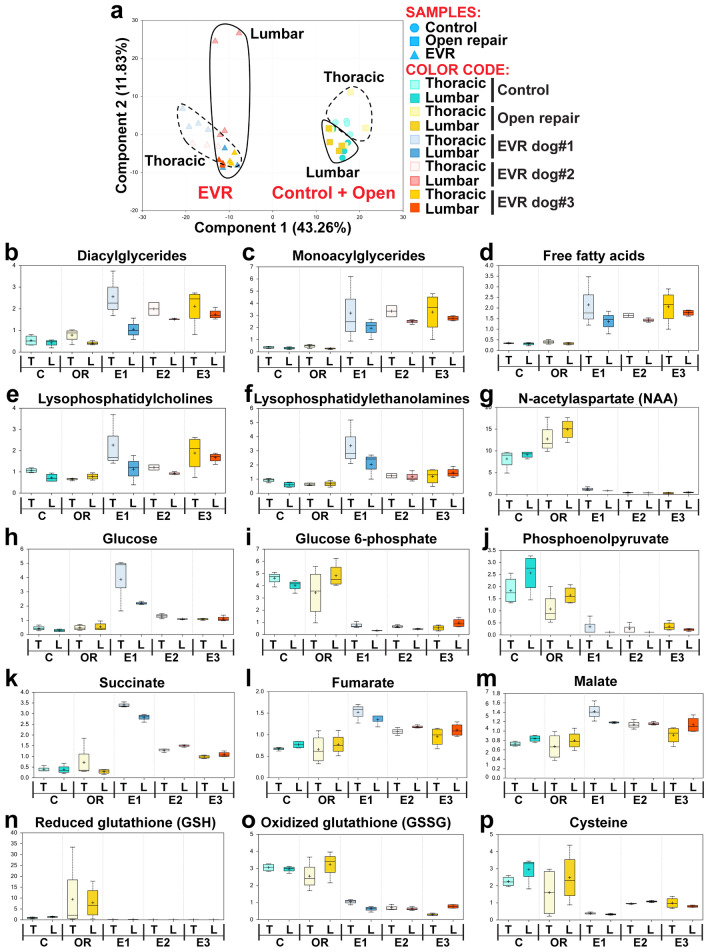
Figure 5.
The SC of EVR and OR dogs show strikingly different types of biochemical changes. (a) Principal component analysis showing a clear separation between the samples from EVR dogs #1–3 and the clustered samples from control and OR dogs. There is also evidence of a more limited separation between the samples from thoracic and lumbar spinal cord. (b)–(p) Box and whisker plots showing the scale intensity for representative metabolites in the thoracic (T) and lumbar (L) SC of control dogs (n = 4), OR dogs (n = 4) and EVR dogs #1–3 (E1, E2 and E3, respectively). Results are presented separately for the three EVR dogs to illustrate the consistency of data between them, irrespective of the extent of stenting. Statistical analyses, however, were conducted using the three EVR dogs as a group. Significance was assessed using a Welch’s two-sample t-Test (p < 0.05).

