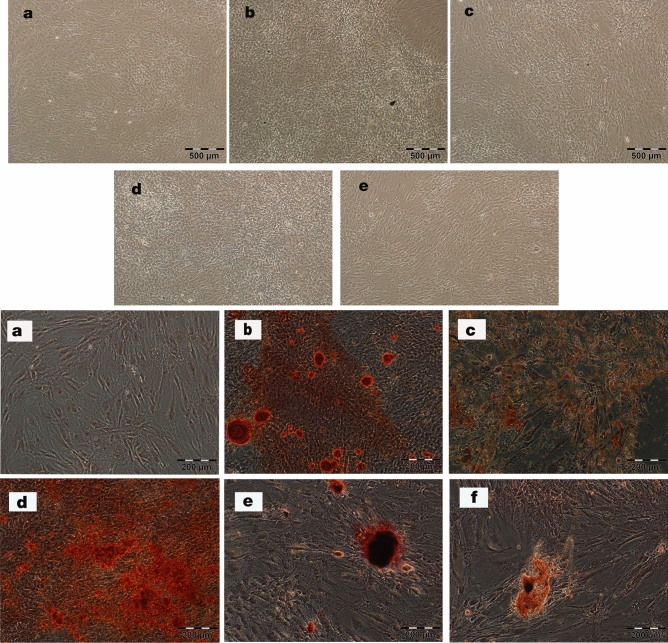
Figure 3.
Top; Morphological analysis of hTERT-MSCs. Untreated cells (a), hTERT-MSCs-IFN-γ (250 U/ml) (b), hTERT-MSCs-poly(I:C) (20 µg/ml) (c), hTERT-MSCs-GFP (d), and hTERT-MSCs-co-transduced with IDO1, PTGS2 and TGF-β1 viral particles (e) upon reaching confluency (light microscope, Olympus, Japan, scale bars represent 500 µm). Bottom; Osteogenic differentiation of hTERT-MSCs. Untreated/unprimed hTERT-MSCs (a) or primed with differentiation inductive medium (b) were considered as controls. Cells primed in the permanent presence of IFN-γ (250 U/ml) (c), or poly(I:C) (20 µg/ml) (d), and following transduction with control GFP (e) or co-transduction with IDO1, PTGS2 and TGF-β1 viral particles (f) are shown. Alizarin red S staining is applied for detection of calcification after 21 days of induction (fluorescent microscope, Olympus, Japan, scale bars represent 200 µm).

