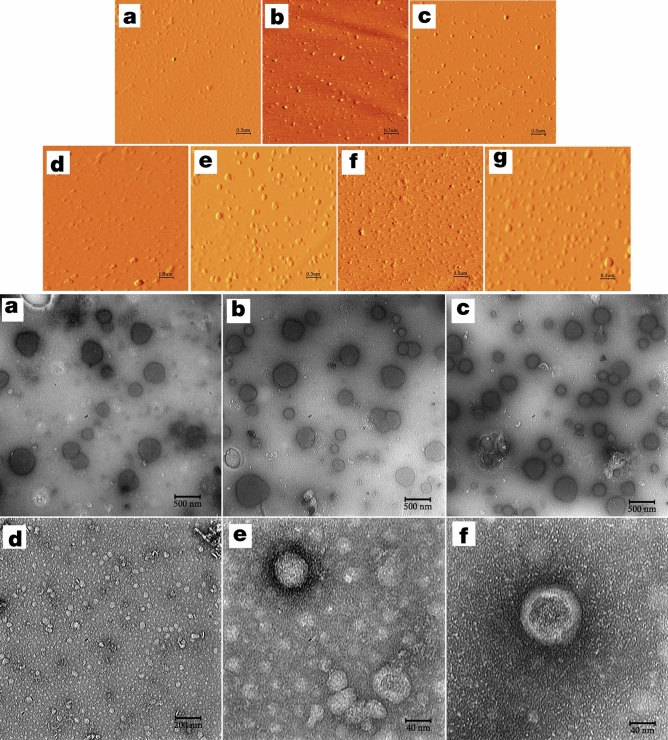
Figure 4.
Top; Atomic force microscopy. (a–c) represent amplitude images obtained for untreated cells, hTERT-MSCs-IFN-γ (250 U/ml), and hTERT-MSCs-poly(I:C) (20 µg/ml) in scan size range of 3 µm. (d–g) represent amplitude images obtained for (hTERT-MSCs)-GFP, -IDO1, -PTGS2 and -TGF-β1, respectively. Three different scan size ranges including 3, 5 and 10 µm were applied for the AFM studies. Image processing and analysis were performed by Imager version 1.00 AraResearch Co. Bottom; Electron micrographs from three hTERT-MSCs-GFP derived EV samples (a–c) using transmission electron microscopy (Leo 912ab, Zeiss, Germany, 120 kV, Tungsten filament, holy carbon film grid). As demonstrated the vesicle-like particles of different sizes (50–200 nm) as well as lipid bilayer membranes of intact spherical EVs are prominent. (d–f) Transmission electron micrographs obtained from PEG-concentrated ultracentrifuge supernatants (20-fold) of the untreated hTERT-MSCs.

