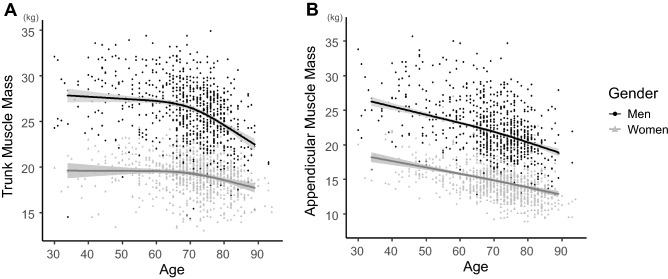
Figure 1.
(A) Association between age and trunk muscle mass adjusted for body mass index (BMI). Trunk muscle mass declined with age in both men and women (p < 0.001, p for non-linear < 0.001). (B) Association between age and appendicular skeletal muscle mass adjusted for BMI. Appendicular skeletal muscle mass declined with age in both genders (men: p < 0.001, p for non-linear = 0.243; women: p < 0.001, p for non-linear = 0.721). Gray zone indicates 95% confidence intervals.

