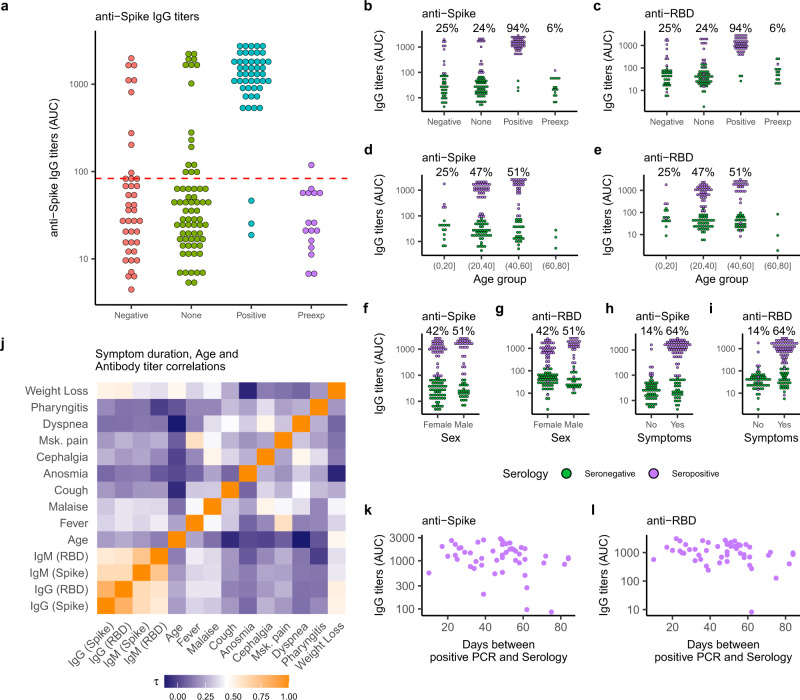
Fig. 1. Serological characterization of the study population.
a Anti-Spike IgG titers shown as area under titration curve (AUC) in sera from investigated subjects grouped by SARS-CoV-2 PCR status (Negative-red circles, None-green circles, Positive-blue circles) plus pre-pandemic historical sera (Preexp, magenta circles). The dotted line illustrates the estimated threshold above which subjects were classified as “Seropositive” (mean + 2xSD–red). Mean and SD was calculated for all IgG titers below the maximum value measured from Preexp sera (n = 63). b–i Anti-Spike (b, d, f, h) and anti-RBD (c, e, g, i) IgG titers shown as AUC for investigated subjects grouped by SARS-CoV-2 PCR status (b–c), age group (d–e), sex (f–g) and reported symptoms (h–i). Subjects are colored by anti-Spike IgG serology results (seropositive-purple circles, seronegative-green circles). Percentage seropositive subjects within each category are indicated. j Detected antibody titers from seropositive subjects were correlated to each other, symptom duration, and subject age using a Kendall rank correlation. A heatmap of the Kendall rank correlation coefficient () is shown for each pair of variables. k–l, Anti-Spike (k), and anti-RBD (l) IgG titers shown as a function of time for seropositive subjects. The approximate time of infection was taken as the day of positive SARS-CoV-2 PCR status.

