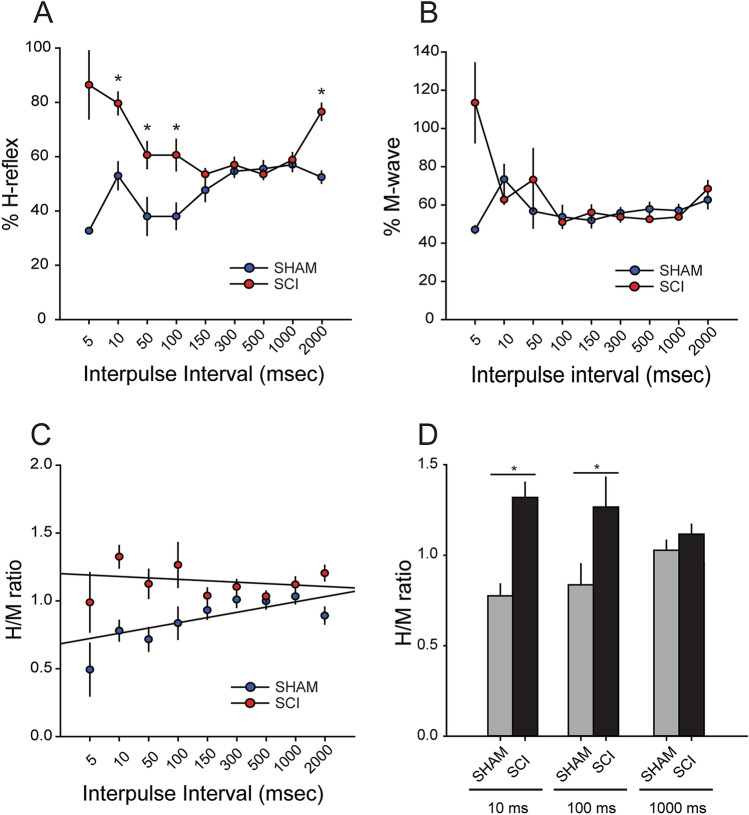
Figure 5.
Enhanced H-reflex response 1-week after SCI. To confirm the development of hyperreflexia after SCI, we measured the H-reflex response using a paired-pulse paradigm (stimulating interpulse intervals 5–2000 ms). (A, B) % H-reflex and % M-wave are normalized values of the test pulse compared to the control pulse. (A) In Sham animals, shorter interpulse intervals are associated with less %H-reflex, demonstrating RDD. After SCI there was significant increase in the %H-reflex at 10, 50, 100 and 2000 ms interpulse intervals (* = p < 0.05). (B) There was no significant difference in %M-wave response between Sham and SCI. (C) H/M ratio was calculated by comparing peak amplitude of the test pulse evoked H- and M-wave response. H/M ratio in Sham produced a greater linear regression slope as compared to SCI, e.g., shallow slope. (D) SCI significantly increased the H/M ratio at 10 and 100 ms compared to Sham (* = p < 0.05). Graphs are mean ± SEM.

