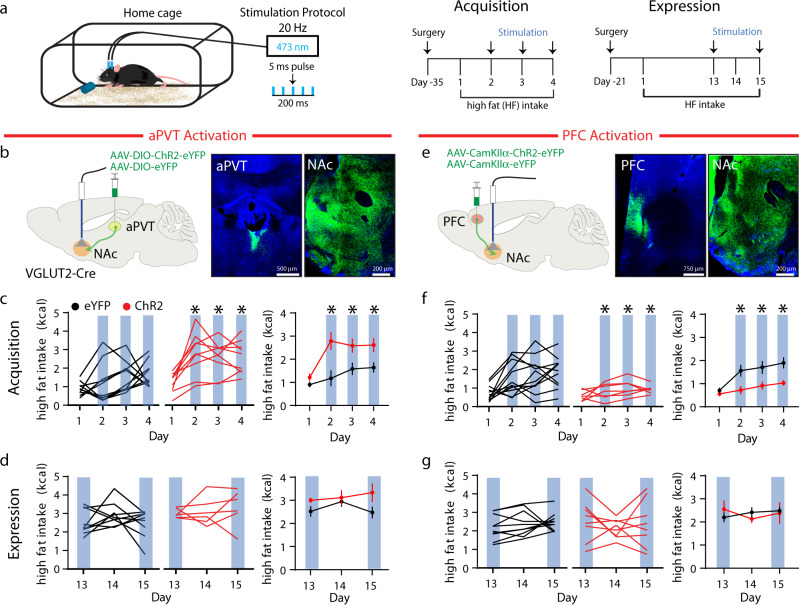
Fig. 1. Activation of distinct NAc glutamatergic inputs has opposing effects on high fat intake.
a Schematic of experimental setup (left); experimental timeline (right). b Schematic of viral injection and ferrule implant for aPVT input stimulation (left); representative images of ChR2 infection in the aPVT and NAc (right). c, d Quantification of high fat intake during acquisition (c: F1,17 = 13.1 P = 0.002, n = 10, 9 mice/group) and expression period (d: F1,13 = 4.03, P = 0.07, n = 9, 6 mice/group) in eYFP control (black) and ChR2 expressing (red) mice. In this and all subsequent figure panels, blue bars signify blue light stimulation; left panels illustrate individual subjects; far right panel displays mean ± s.e.m. e Schematic of viral injection and ferrule implant for PFC input stimulation (left); representative images of ChR2 infection in the PFC and NAc (right). f, g Quantification of high fat intake during acquisition (f: F1,18 = 9.03, P = 0.008, n = 10, 8 mice/group) and expression period (g: F1,16 = 0.001, P > 0.05, n = 10, 8 mice/group). Data are mean ± s.e.m. *P < 0.05, two-way ANOVA with Sidak’s multiple comparison post hoc test. The schematic of the mouse brain in this and all subsequent figures has been adapted with permission from Paxinos & Franklin57. Source data are provided as a Source Data file.

