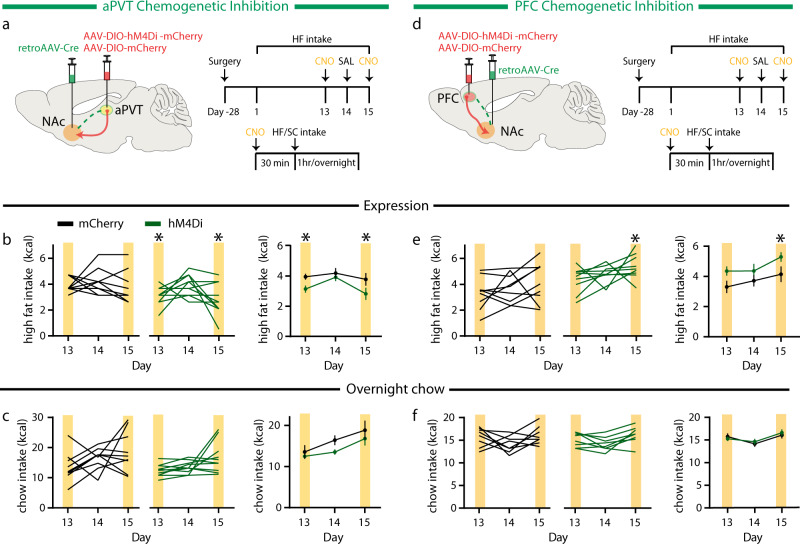
Fig. 3. Inhibition of distinct NAc projecting neurons selectively regulates high fat intake.
a Schematic of viral injection for NAc projecting aPVT neuron inhibition (left); experimental timeline (right). b Quantification of high fat intake during expression period (F1,18 = 4.94, P = 0.03, n = 10 mice/group) in mCherry control (black) and hM4Di expressing (green) mice. Yellow bars signify CNO administration. c Quantification of overnight standard chow intake during expression period (F1,18 = 3.5, P > 0.05, n = 10 mice/group) in mCherry control (black) and hM4Di expressing (green) mice. d Schematic of viral injection for NAc projecting PFC neuron inhibition (left); experimental timeline (right). e Quantification of high fat intake during expression period (F1,17 = 5.27, P = 0.03, n = 9, 10 mice/group) in mCherry control (black) and hM4Di expressing (green) mice. f Quantification of overnight standard chow intake during expression period (F1,17 = 0.19, P > 0.05, n = 9, 10 mice/group) in mCherry control (black) and hM4Di expressing (green) mice. Data are ±s.e.m. *P < 0.05, two-way ANOVA with Sidak’s or Tukey’s multiple comparison post hoc test. Source data are provided as a Source Data file.

