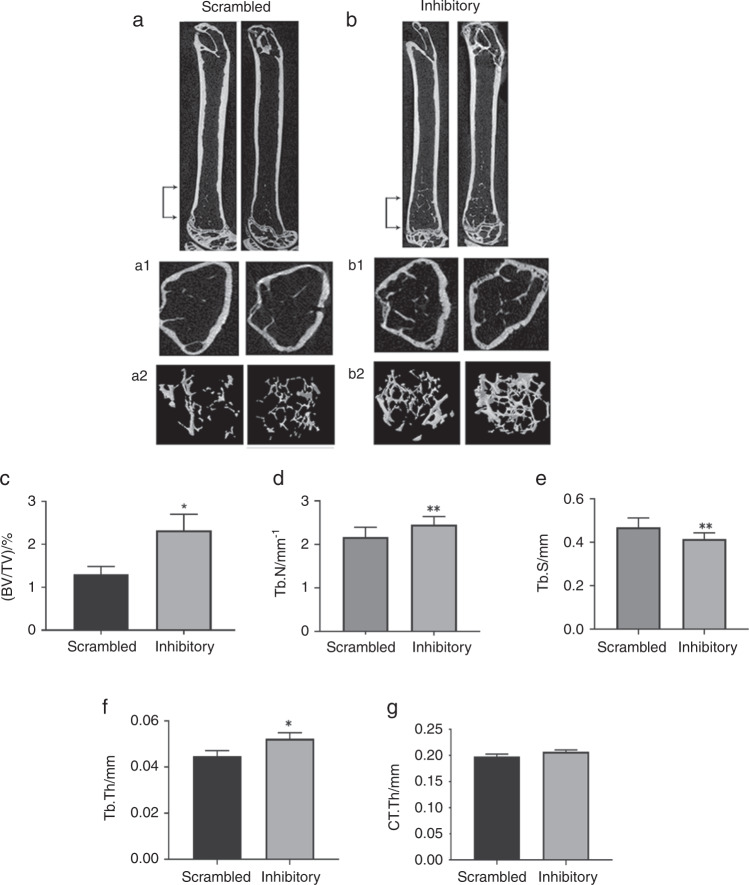
Fig. 2.
Representative longitudinal sections of femurs isolated from mice injected with indicated peptides are shown in duplicates. Micro-CT 3D-construction of the trabecular and cortical bone area indicated by bracketed arrows (region of interest, ROI) in (a & b). a1 and b1 Representative cross-sections of the femur in the metaphyseal area revealed cortical and trabecular bone. a2 and b2: c–g Comparison of the indicated micro-CT parameters were done in mice injected with scrambled and inhibitory peptides. Bone volume to total volume (BV/TV), trabecular number (Tb. N), trabecular spacing (Tb.S), trabecular thickness (Tb. Th), and cortical bone thickness (CT.Th) were measured in the bones of nine mice and provided as bar graphs. The analysis was done thrice. Two times five mice and one time, nine mice were used for each group. The data shown are the results obtained from the experiment done with nine mice (n = 9 per group). Statistical analyses were done using a standard Student’s t test. Data shown are mean ± SEM; *P < 0.05; **P < 0.01; vs. scrambled peptide injected mice. Data are also offered as a scatterplot in Fig. S4

