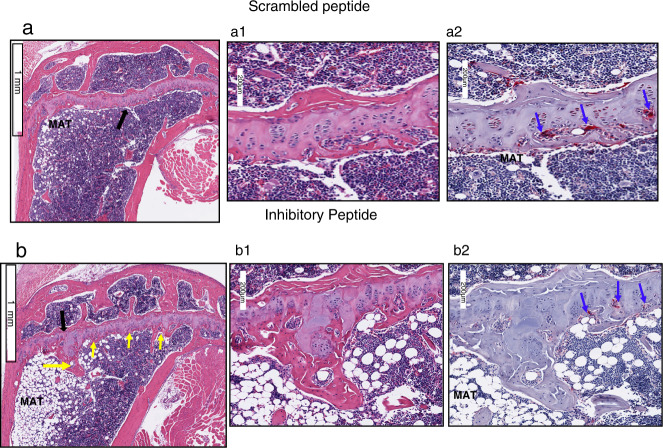
Fig. 3.
Bone sections were stained with H&E and TRAP-stains (n = 9 per group). H and E stained sagittal sections of the proximal tibia are shown (a and b). A black arrow in (a and b) points to the area of magnification shown in (a1 and b1). The corresponding region of the magnified image is shown from the TRAP stained bone section (a2 and b2). Scale Bar-1 mm in (a and b); 200 µm in (a1, a2, b1, and b2). Yellow arrows in (b) point to the trabecular bone, and blue arrows point to osteoclasts in TRAP-stained sections (a2 and b2). MAT - marrow adipose tissue. Three bone sections from three different mice are shown for each injection in fig. S3

