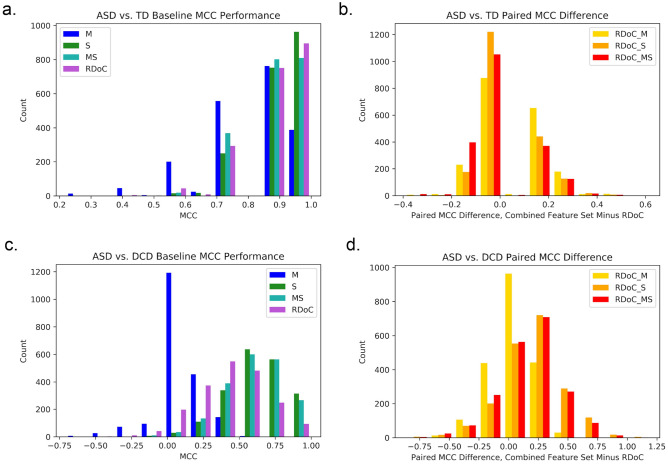
Figure 1.
MCC decoding performance of optimized feature sets. Histogram of baseline MCC performance of separate feature sets in decoding (a) ASD from TD and (c) ASD from DCD across all 2000 CV folds in cool colors. Histogram of paired difference between combined feature sets and RDoC alone between (b) ASD and TD and (d) ASD and DCD in hot colors. M motor, S sensory, MS motor and sensory, RDoC_M RDoC and motor, RDoC_S RDoC and sensory, RDoC_MS RDoC, motor and sensory.

