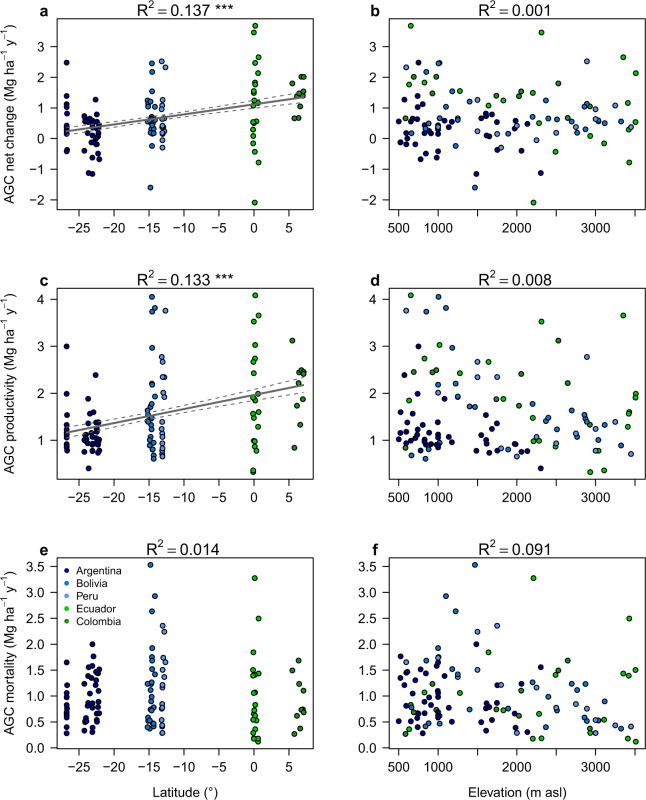
Fig. 2. Aboveground carbon dynamics along elevational and latitudinal gradients.
Generalized additive models (GAMs) assessing the changes of the aboveground carbon (AGC) dynamics in relation to latitude (°) (a, c, e) and elevation (m asl) (b, d, f), across 119 forest-monitoring plots in the subtropical and tropical Andes. Negative latitudinal values represent plots in the Southern hemisphere and positive latitudinal values represent plots in the Northern hemisphere. Solid lines represent the models that were statistically significant and da shed lines represent 95% confidence intervals. *P ≤ 0.05; **P ≤ 0.01; ***P ≤ 0.001. AGC net change = aboveground carbon net change (Mg C ha−1 y−1). AGC productivity = aboveground carbon productivity (Mg C ha−1 y−1). AGC mortality = aboveground carbon mortality (Mg C ha−1 y−1). R2 = Coefficient of determination of the model.

