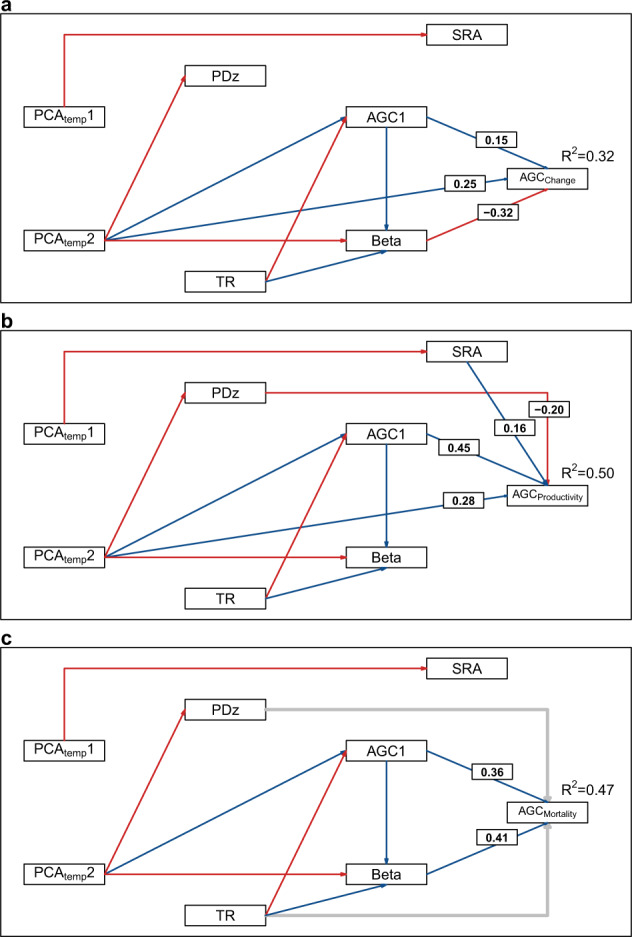
Fig. 3. Drivers of aboveground carbon dynamics in the Andes.

Structural equation models (SEMs) used to evaluate the effects of climate (PCAtemp1 and PCAtemp2), initial aboveground carbon stock in each plot (AGC1; Mg C ha−1), thermophilization rate (TR; °C y−1), symbiotic root associations (SRA = ln(AM/EcM)), the standardized effect size of the phylogenetic diversity (PDz), and the size-dependent probability of mortality (β) on aboveground carbon dynamics. AGCchange = aboveground carbon net change (Mg C ha−1 y−1) (a). AGCproductivity = aboveground carbon productivity (Mg C ha−1 y−1) (b). AGCmortality = aboveground carbon mortality (Mg C ha−1 y−1) (c). Red arrows indicate negative relationships and black arrows indicate positive relationships. Grey arrows represent significant (P ≤ 0.05) relationships in the IT models (Supplementary Table 7), but not in the SEM models. The values over the arrows are the associated linear coefficients of the explanatory variables found to be significant. R2 = Coefficient of determination of the overall model.
