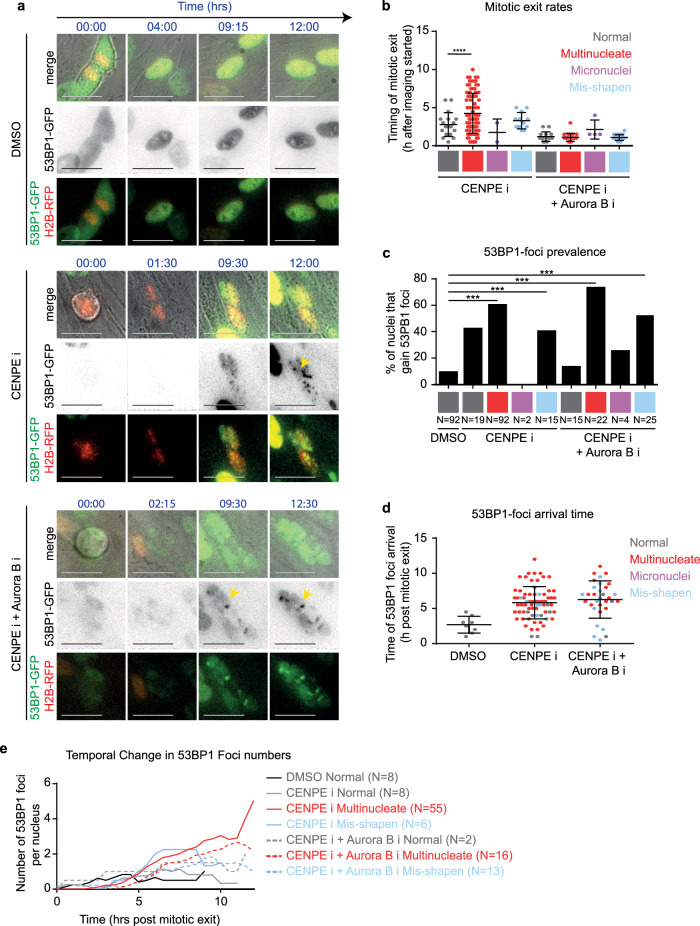
Fig. 2. Multinucleate cells exhibit delayed DNA damage signalling and an increase in damage foci through time.
a Representative time-lapse images of normal shaped nuclei exiting mitosis after DMSO treatment, or multinucleated cells exiting mitosis after CENPE i or CENPEi and Aurora Bi treatment as in Supplementary Fig. 5a. Scale 25 μm. Yellow arrows indicate 53BP1-GFP foci within multinucleate cells. In the 53BP1-GFP lane, GFP intensities are inverted to highlight 53BP1-foci as soon as they form (associated supplementary movies present non-inverted GFP intensities). b Graph shows the timing of mitotic exit, based on nuclear morphology of daughter cells (indicated by colour). Statistical significance was assessed using an unpaired student’s t test. **** indicates p < 0.0001. c Graph of the proportion of daughter nuclei which gain 53BP1 foci during time-lapse imaging. N values below bars indicate the number of nuclei from at least three independent experimental repeats. Statistical significance was assessed using a proportions test with 95% confidence interval. *** indicates p < 0.001. d Graph of the timing of 53BP1 foci arrival in nuclei which gain 53BP1 foci, after drug treatments as indicated. Time-lapse movies as in Fig. 2a were used to determine the earliest time-point of visible 53BP1 foci following mitotic exit. Each value represents one nucleus. The colour of plotted values represents nuclear morphology. e Quantification of 53BP1 foci number per nucleus over time from mitotic exit.

