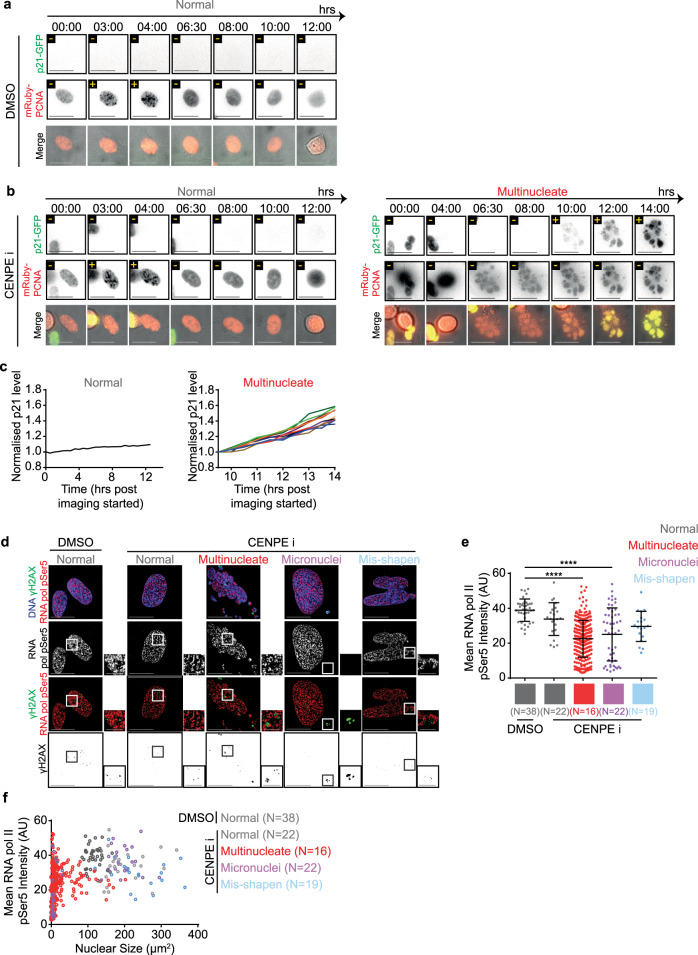
Fig. 4. Multinucleation favours heterogeneous nuclear protein levels.
Representative images of RPE1 mRuby-PCNA p21-GFP cells treated with DMSO (a) or CENPEi (b) for 16 h and washed 10 h prior to live-cell imaging for 14 h. Scale bar 25 μm. Yellow ± refers to p21 or PCNA foci positive or negative respectively. Images show a normal shaped nucleus with low p21 and nuclear PCNA foci and a multinucleate cell, exiting mitosis and building p21-GFP levels through time, without gaining nuclear PCNA foci. c Graph of the mean p21 level per nucleus for the normal, or per compartment for multinucleated cells from movies as in Fig. 4a & b. Values are normalised to the mean p21 value from the first time point measured. PCNA signal was used to identify nuclear areas. Colours of lines correspond to different nuclear compartments. d RPE1 cells treated with DMSO or CENPEi for 16 h were fixed 48 h later for immunostaining with antibodies against gamma H2AX and RNA pol II CTD pSer5. DNA was stained with DAPI. Representative images of non-overlap between gamma H2AX and RNA pol II pSer5 in cells following DMSO (control) or CENPEi treatment. Scale 15 μm; insets 5 μm. e Graph of the mean RNA pol II CTD pSer5 intensity per nucleus (normal or misshapen nuclei) or nuclear compartment (micronucleated and multinucleate). Each plot represents one nucleus/nuclear compartment respectively. N refers to the number of cells analysed, across 3 independent repeats. Statistical significance was assessed using a one way ANOVA with multiple comparisons. f Mean RNA pol II CTD pSer5 intensity per nucleus/nuclear compartments plotted against the size of the nucleus/nuclear compartment. Line colours represent nuclear morphology as indicated. N refers to the number of cells from 3 independent repeats.

