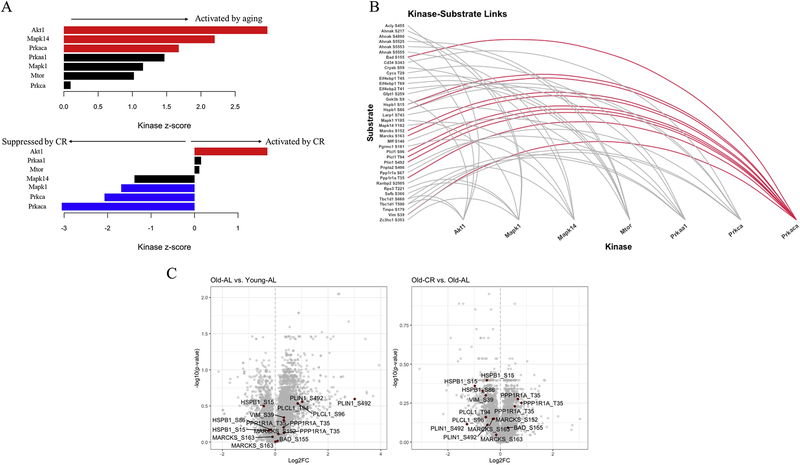
Fig. 2.
Pathway analysis reveals that PKA pathway is activated by aging and suppressed by CR. (A) Output of kinase-substrate enrichment analysis (KSEA). Red and blue bars indicate significant differences (p < 0.05). (B) Depiction of kinase-substrate links produced by analysis in (A). (C) Volcano plots for Old-AL vs. Young-AL, and Old-CR vs. Old-AL comparisons. Data points in maroon indicate known PKA targets identified by KSEA.

