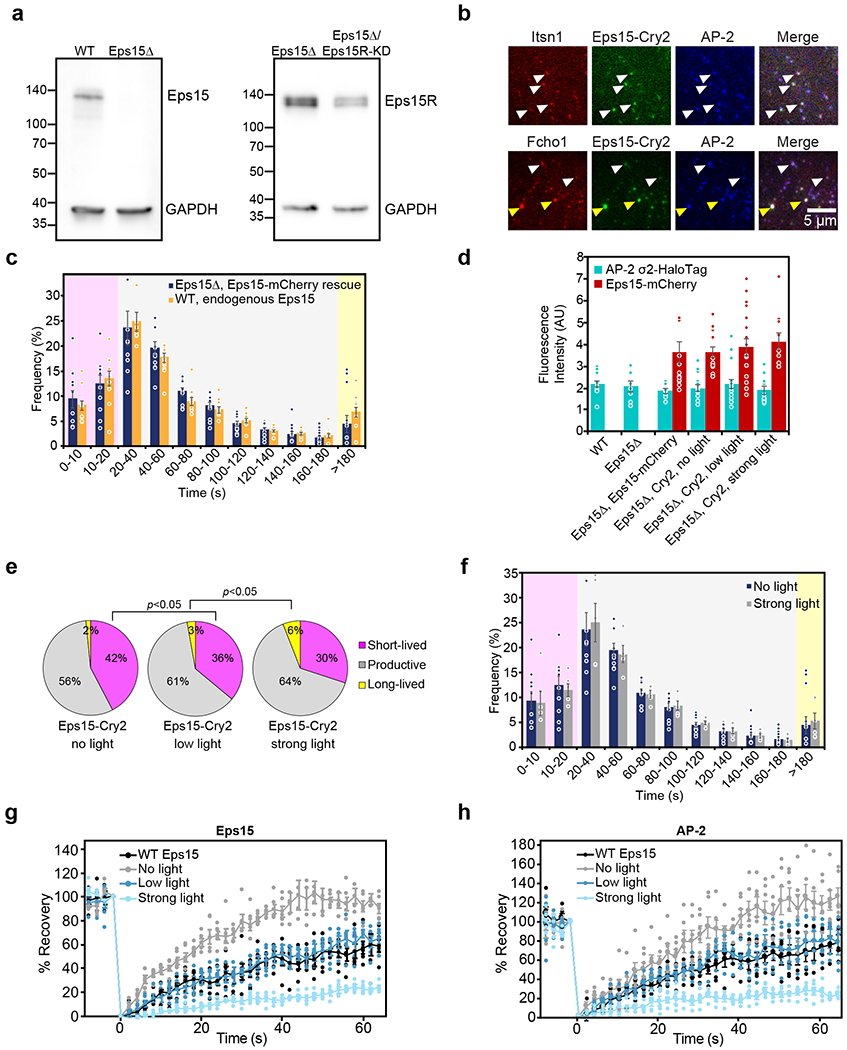
Extended Data Figure 5: Controls for Eps15-Cry2 cell experiments.

(a) Left: whole cell lysates from WT SUM159/AP-2-HaloTag cells and WT SUM159/AP-2-HaloTag cells gene edited by CRISPR to disrupt Eps15 were separated by SDS-PAGE and immunoblotted for Eps15 and GAPDH. Right: whole cell lysates from WT SUM159/AP-2-HaloTag cells and WT SUM159/AP-2-HaloTag cells transfected with siRNA against Eps15R were collected 24 hours post-transfection. Proteins were separated by SDS-PAGE and immunoblotted for Eps15R and GAPDH. (b) Itsn1-mCherry (upper panels), Fcho1-mCherry (lower panels), Eps15-Cry2-GFP, and AP2-HaloTag conjugated to JF646 colocalize in Eps15Δ cells expressing Eps15-Cry2 and exposed to low blue light levels. White arrowheads indicate examples of colocalization in endocytic structures. Notably, Fcho1-mCherry/Eps15-Cry2-GFP co-expression often resulted in the formation of large, persistent aggregates on the plasma membrane, denoted by yellow arrowheads. Scale bar is 5 μm. (c) The lifetime distributions of AP-2 σ2-HaloTag-labeled endocytic structures in Eps15 knockout cells expressing Eps15-mCherry and in wild-type Eps15 cells are nearly identical. (d) The average plasma membrane fluorescence intensity of AP-2 σ2-HaloTag::JF646 and Eps15-mCherry in the first frame of each movie analyzed in a and Figure 4. Eps15Δ n=10 biologically independent cell samples, 25,269 pits. WT Eps15 n=10 biologically independent cell samples, 8,969 pits. No light n=11 biologically independent cell samples, 21,996 pits. Low light n=17 biologically independent cell samples, 14,222 pits. Strong light n=12 biologically independent cell samples, 13,978 pits. (e) Lifetime distributions of clathrin-coated structures in Eps15Δ/Eps15R knockdown cells expressing Eps15-Cry2 at no, low, or strong blue light exposure. Plots show frequency of short-lived (<20 s, magenta), productive (20-180 s, gray), and long-lived (>180 s, yellow) structures for each condition. No blue light exposure resulted in 42 ± 3% (SEM) of CCPs being short-lived (<20 s). Low blue light exposure significantly reduced the frequency of short-lived CCPs from 42 ± 3% to 36 ± 4% (t-test, p=0.042, n=5, 5). While 2-3% of pits were long-lived (>180 s) in cells exposed to no or low blue light, the frequency of long-lived pits increased significantly to 6 ± 1% (t-test, p=0.009, n=5, 5) in cells exposed to strong blue light. No light n=5 biologically independent cell samples, 31,427 pits. Low light n=5 biologically independent cell samples, 27,026 pits. Strong light n=5 biologically independent cell samples, 17,623 pits. (f) The lifetime distributions of AP-2 σ2-HaloTag-labeled endocytic structures in Eps15 knockout cells expressing Eps15-mCherry exposed to either no blue light or 50 μW “strong” blue light are nearly identical. (g) Plot from Fig. 6f and (h) plot from Fig. 6h displaying the individual data points that were averaged together for each FRAP curve. n=5-6 biologically independent samples. Data are presented as mean ± SEM. See Source Data Extended Data Figure 5.
