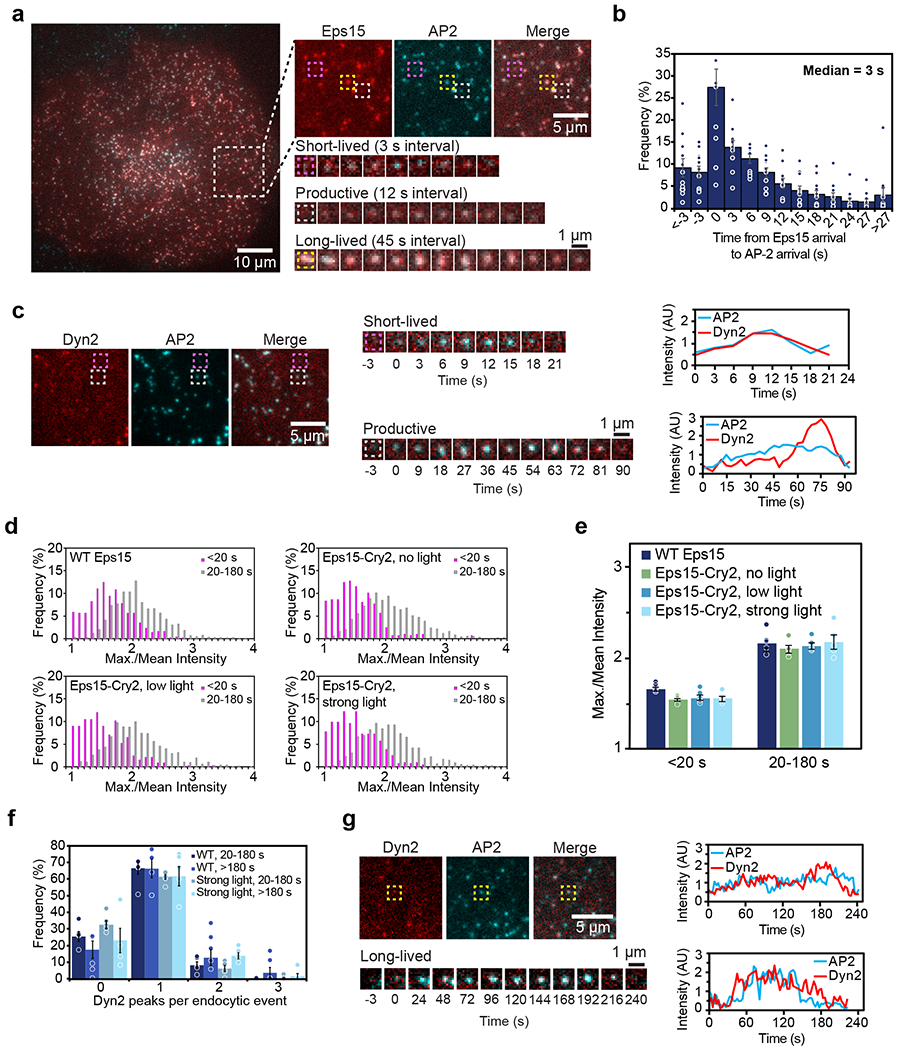
Figure 5: Lifetimes of endocytic pits correspond to abortive, productive, or stalled events.

(a) Representative image of a cell expressing gene-edited AP-2 σ2-HaloTag:JF646 (cyan) and Eps15-mCherry (red). Large inset highlights three representative clathrin-coated structures shown in smaller insets: abortive (magenta), productive (gray), and stalled (yellow) structures lasting 18 s, 96 s, and > 10 min, respectively. (b) Histogram of the distribution of the difference in arrival times between Eps15-mCherry and AP-2 σ2-HaloTag:JF646 in endocytic structures in Eps15 knockout cells. Positive times indicate that Eps15 signal appeared before AP-2 signal. n=11 biologically independent cell samples. (c) Representative image of a cell expressing gene-edited AP-2 σ2-HaloTag:JF646 (cyan) and Dyn2-mCherry (red). Representative abortive (magenta) and productive (gray) clathrin-coated structures are indicated by the boxes and shown in smaller insets. Line plots show intensity measurements for the abortive (top) and productive (bottom) pit. (d) Histograms of the distribution of Dyn2 max./mean intensity. (WT Eps15: 1,394 pits; Eps15-Cry2, no light: 1,350 pits; Eps15-Cry2, low light: 1,310 pits; Eps15-Cry2, strong light: 1,507 pits.) (e) Median distribution of Dyn2 max./mean intensity for each lifetime cohort for each light condition. n= 5 biologically independent cell samples. (f) Histogram of the distribution of Dyn2 peaks per endocytic event among productive (20-180 s) events in cells expressing WT Eps15 compared to long-lived (>180 s) events in cells expressing Eps15-Cry2 and exposed to strong light. n= 5 biologically independent cell samples. (g) A typical long-lived clathrin-coated structure is indicated by the yellow box and shown in lower panels over time. Line plots show intensity measurements of AP-2 and Dyn2 for two representative clathrin-coated structures. Dyn2 signal was variable in long-lived structures and often displayed either a single peak at the end of an event (top plot) or no distinct peak (bottom plot). All data are presented as mean ± SEM. See Source Data Figure 5.
