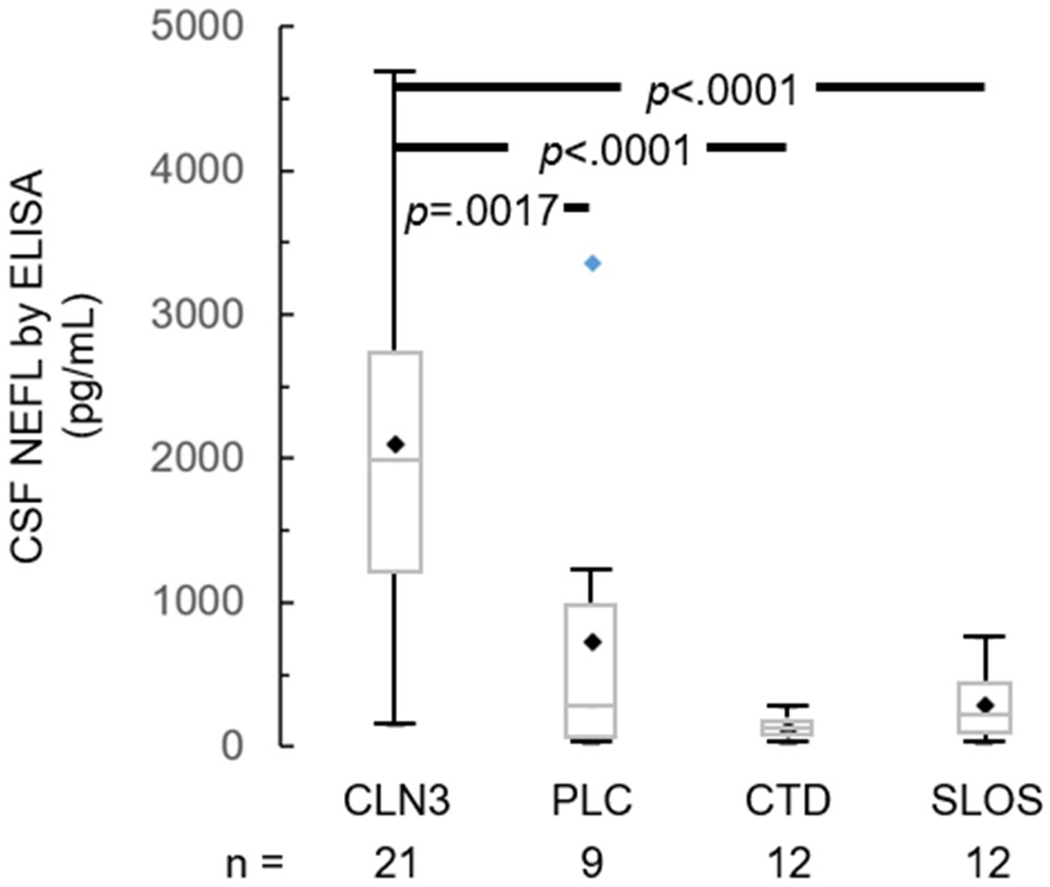
Figure 1.

CSF NEFL level in samples from CLN3 versus non-CLN3 (PLC, CTD, SLOS) individuals, measured by ELISA. Black diamond – mean; blue diamond – outlier; box – median and interquartile range [IQR, Q1 (25th percentile) - Q3 (75th percentile)]; whiskers – minimum = Q1 – 1.5*IQR and maximum = Q3 + 1.5*IQR. P values are derived from ANOVA and post-hoc Bonferroni adjustment for pairwise multiple comparisons. CSF: cerebrospinal fluid. CTD: creatine transport deficiency. NEFL: neurofilament light chain. PLC: pediatric laboratory controls. SLOS: Smith-Lemli-Opitz syndrome.
