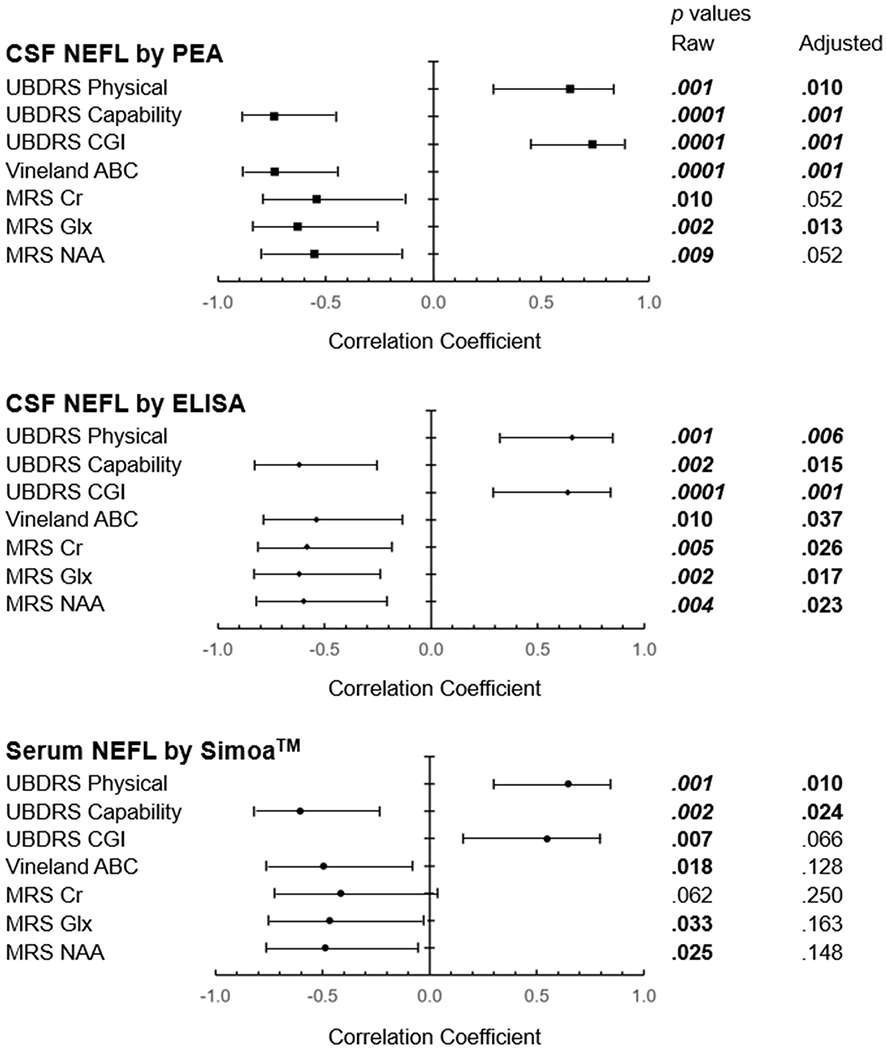
Figure 3.

Correlation of NEFL levels with clinical outcome measures, by assay method. Forest plot indicates the correlation coefficients along with 95% confidence limits. The horizontal axes describe the magnitude of the correlation coefficients, with <0 suggesting inverse relations and >0 suggesting positive relations. Adjusted p values are derived from the Stepdown Bonferroni method for multiple comparisons. Bold – p<.05. Bold italics – p<.01. ABC: adaptive behavior composite. CGI: clinical global impression. Cr: creatine. CSF: cerebrospinal fluid. Glx: glutamatergic metabolites. NAA: N-acetylaspartate. NEFL: neurofilament light chain. PEA: proximal extension assay. Simoa™: single molecule array. UBDRS: Unified Batten Disease Rating Scale.
