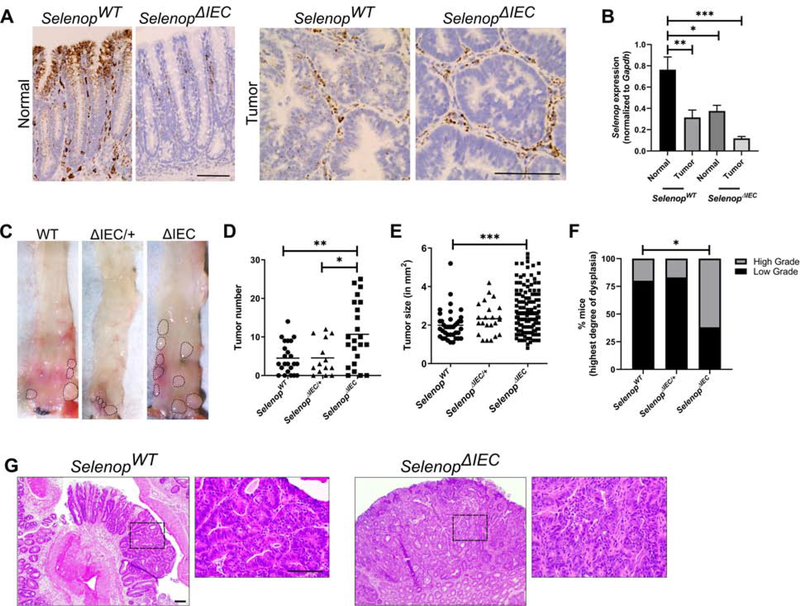
Figure 5. Epithelial-specific Selenop loss augments inflammatory tumorigenesis.
(A) Cohorts of SelenopWT (n=23), SelenopΔIEC/+ (n=15), and SelenopΔIEC (n=23) mice were placed on the AOM/DSS inflammatory tumorigenesis protocol. Selenop mRNA expression was detected in adjacent non-tumor (left) and tumor tissues (right) by RNAScope. (B) Selenop qPCR (n=6 non-tumor and 5 tumor samples/genotype with 3 technical replicates). (C) Gross tumor images, (D) tumor number, and (E) tumor size as measured with calipers and represented as length × width. (F) Degree of tumor dysplasia as assessed by pathologist. Data represented as percentage of mice with at least one tumor showing high-grade dysplasia (n=14 SelenopWT, 11 SelenopΔIEC/+, and 16 SelenopΔIEC samples). (G) Representative hematoxylin and eosin stained images. Area of enlargement noted by dotted lines. Scale bar = 50μm. *P<0.05, **P<0.01, ***P<0.001, one-way ANOVA with Tukey’s multiple comparisons test (B, D, E) or chi-squared test (F, WT vs. ΔIEC).

