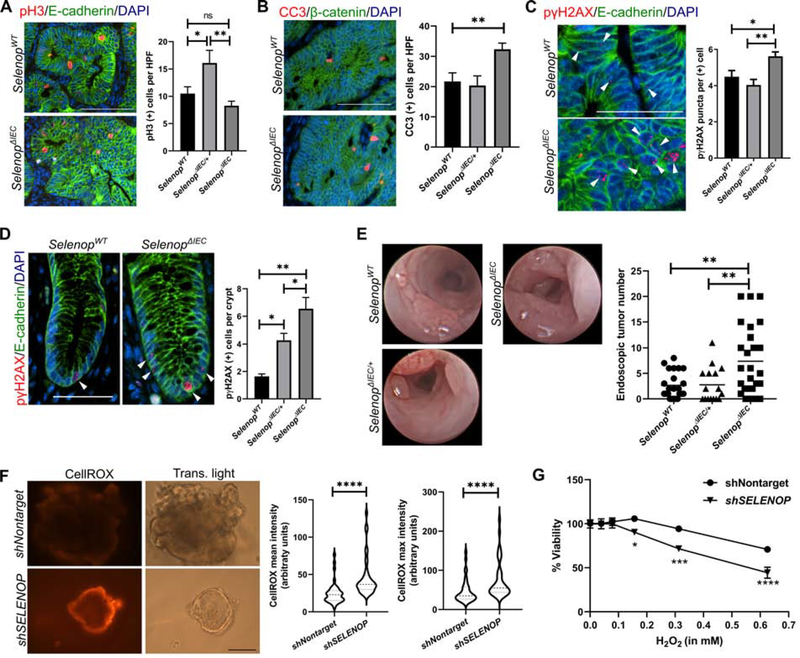
Figure 6. Epithelial Selenop loss increases DNA damage and tumor initiation.
(A) Representative images (left) and quantification (right) of proliferative tumor cells by staining for phospho-histone H3 (pH3, red). Cells were co-labeled with E-cadherin (green) and DAPI (blue). (B) Representative images (left) and quantification (right) of intratumoral apoptosis by staining for cleaved caspase 3 (CC3, red) co-labeled with β-catenin (green) and DAPI (blue). n=29 SelenopWT, 8 SelenopΔIEC/+, and 35 SelenopΔIEC HPFs for A and B. Scale bar = 50μm. (C) Representative images (arrowheads, left) and quantification (right) of intratumoral DNA damage by staining for phospho-γH2AX (pγH2AX, red) co-labeled with E-cadherin (green) and DAPI (blue). Quantification is represented as number of staining puncta per positive cell (n>200 cells/genotype). Scale bar = 25μm. (D) Representative images (arrowheads, left) and quantification (right) of phospho-γH2AX staining in adjacent non-tumor tissue represented as positive cells per crypt (n=74 SelenopWT, 28 SelenopΔIEC/+, and 65 SelenopΔIEC crypts). Scale bar = 25μm. (E) Representative endoscopy stills (left) and quantification (right) of tumor number after the second DSS cycle (n=19 SelenopWT, 16 SelenopΔIEC/+, and 27 SelenopΔIEC). (F) SELENOP knockdown (shSELENOP) and control (shNontarget) human UC organoids were stained with CellROX Orange to detect ROS. Representative images (left) and quantification (right) of mean and maximum intensities by ImageJ, represented as arbitrary units (n=3 independent experiments, 39 images total). Scale bar = 50μm. (G) Nontargeted and shSELENOP UC organoids were treated overnight with H2O2. Viability was assessed after 24 hours by CellTiter-Blue and normalized to pre-treatment readings (n=2 independent experiments with 3 technical replicates). *P<0.05, **P<0.01, ***P<0.001, ****P<0.0001, one-way ANOVA with Tukey’s multiple comparisons test (A-E), Student’s t test (F), or two-way ANOVA (G).

