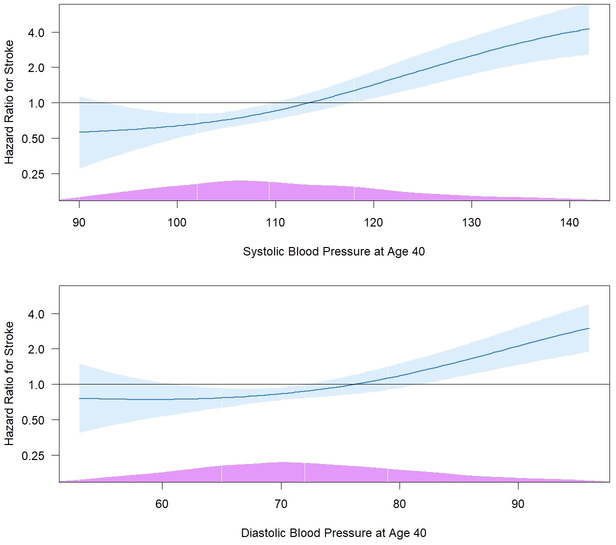
Figure 3.
Spline-based hazard ratios (95% confidence intervals) for stroke incidence associated with systolic blood pressure (upper panel) and diastolic blood pressure (lower panel), in mm Hg, as measured at age 40 years or last before. The curves are based on multivariable Cox models adjusted for covariates assessed at age 40 years or last before, including race, sex, study center, education, antihypertensive medications, smoking, diabetes, LDL cholesterol, HDL cholesterol, BMI, physical activity, and excessive alcohol use. The reference points are 114 and 76 mm Hg (65th percentile) for systolic and diastolic blood pressure, respectively. The histograms at the bottom (purple) show the distribution of blood pressure in the sample. The highest and lowest 2.5% of blood pressure values have been winsorized for visualization purposes.

