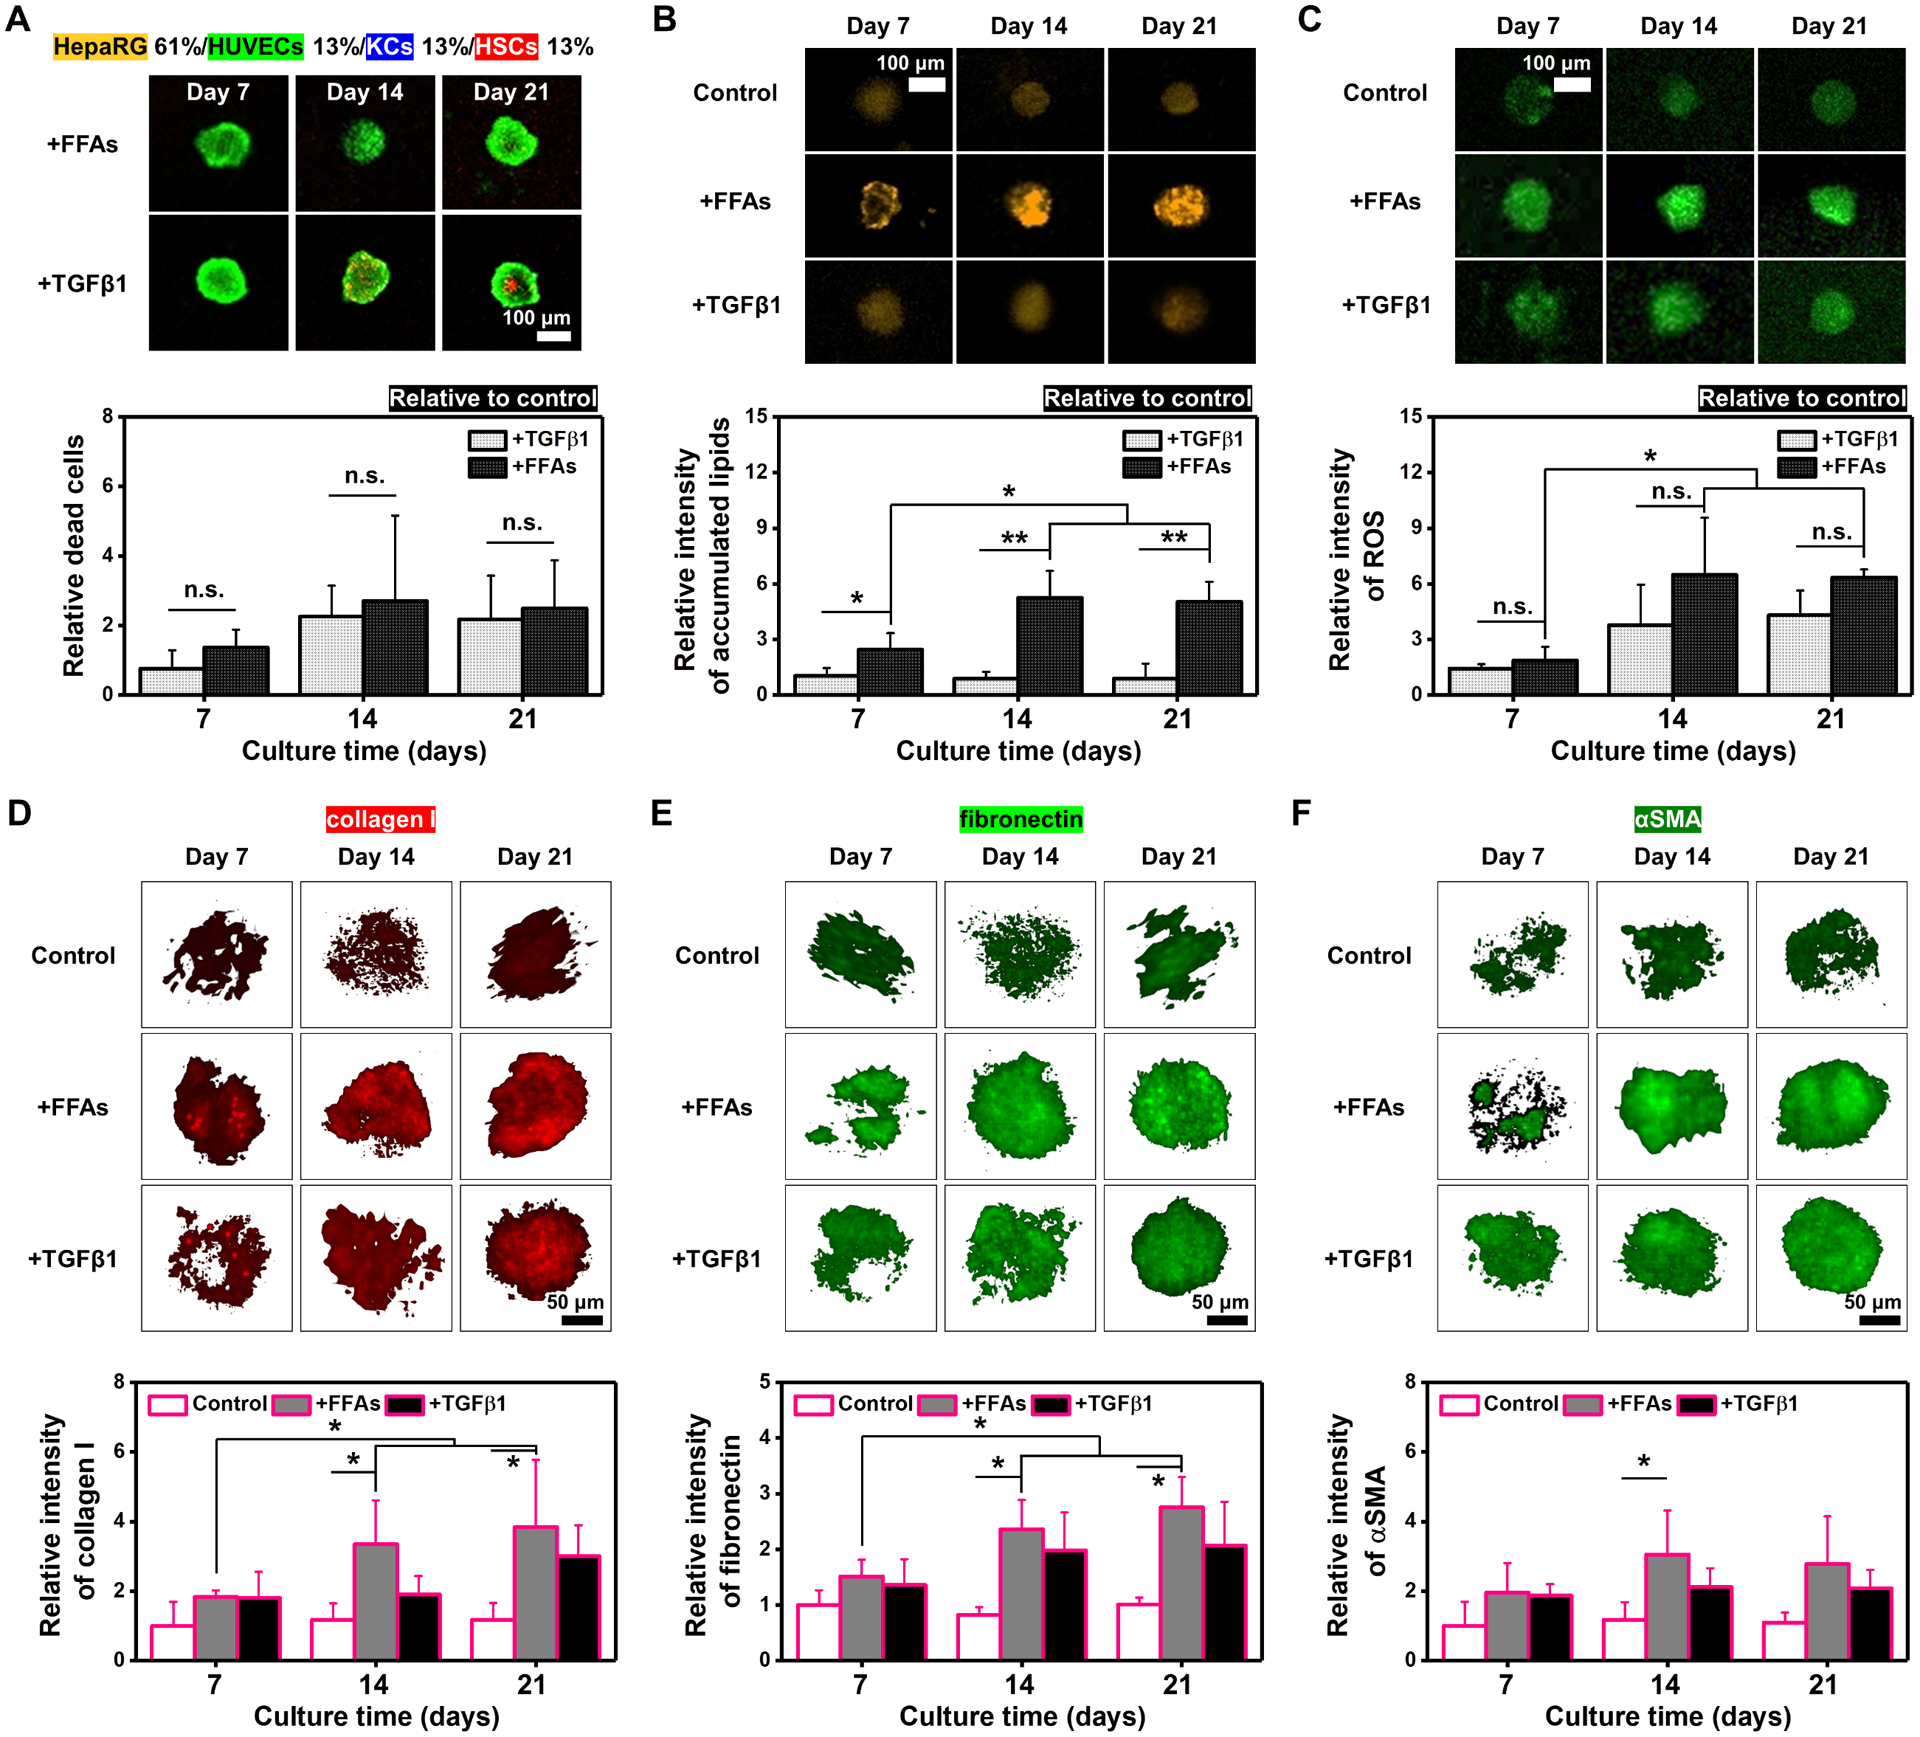
Figure 3. Comparison between fibrotic BE-MLMs induced by the natural progression of NAFLD and TGFβ1 supplement.

A) Representative live (green)/dead (red) images of BE-MLMs supplemented with FFAs or TGFβ1 in the presence of HSCs on days 7, 14, and 21. Quantification of dead cells on days 7, 14, and 21 relative to control without the supplement of FFAs and TGFβ1 (n = 4). Representative confocal images and quantification of B) accumulated lipids and C) produced ROS in BE-MLMs supplemented with FFAs or TGFβ1 for 21 days (n = 4). Representative confocal images and relative intensity of D) collagen I, E) fibronectin, and F) αSMA in BE-MLMs supplemented with FFAs or TGFβ1 on days 7, 14, and 21 (n = 4). Error bars indicate standard deviation. ANOVA, *P < 0.05, **P < 0.005, between specified groups.
