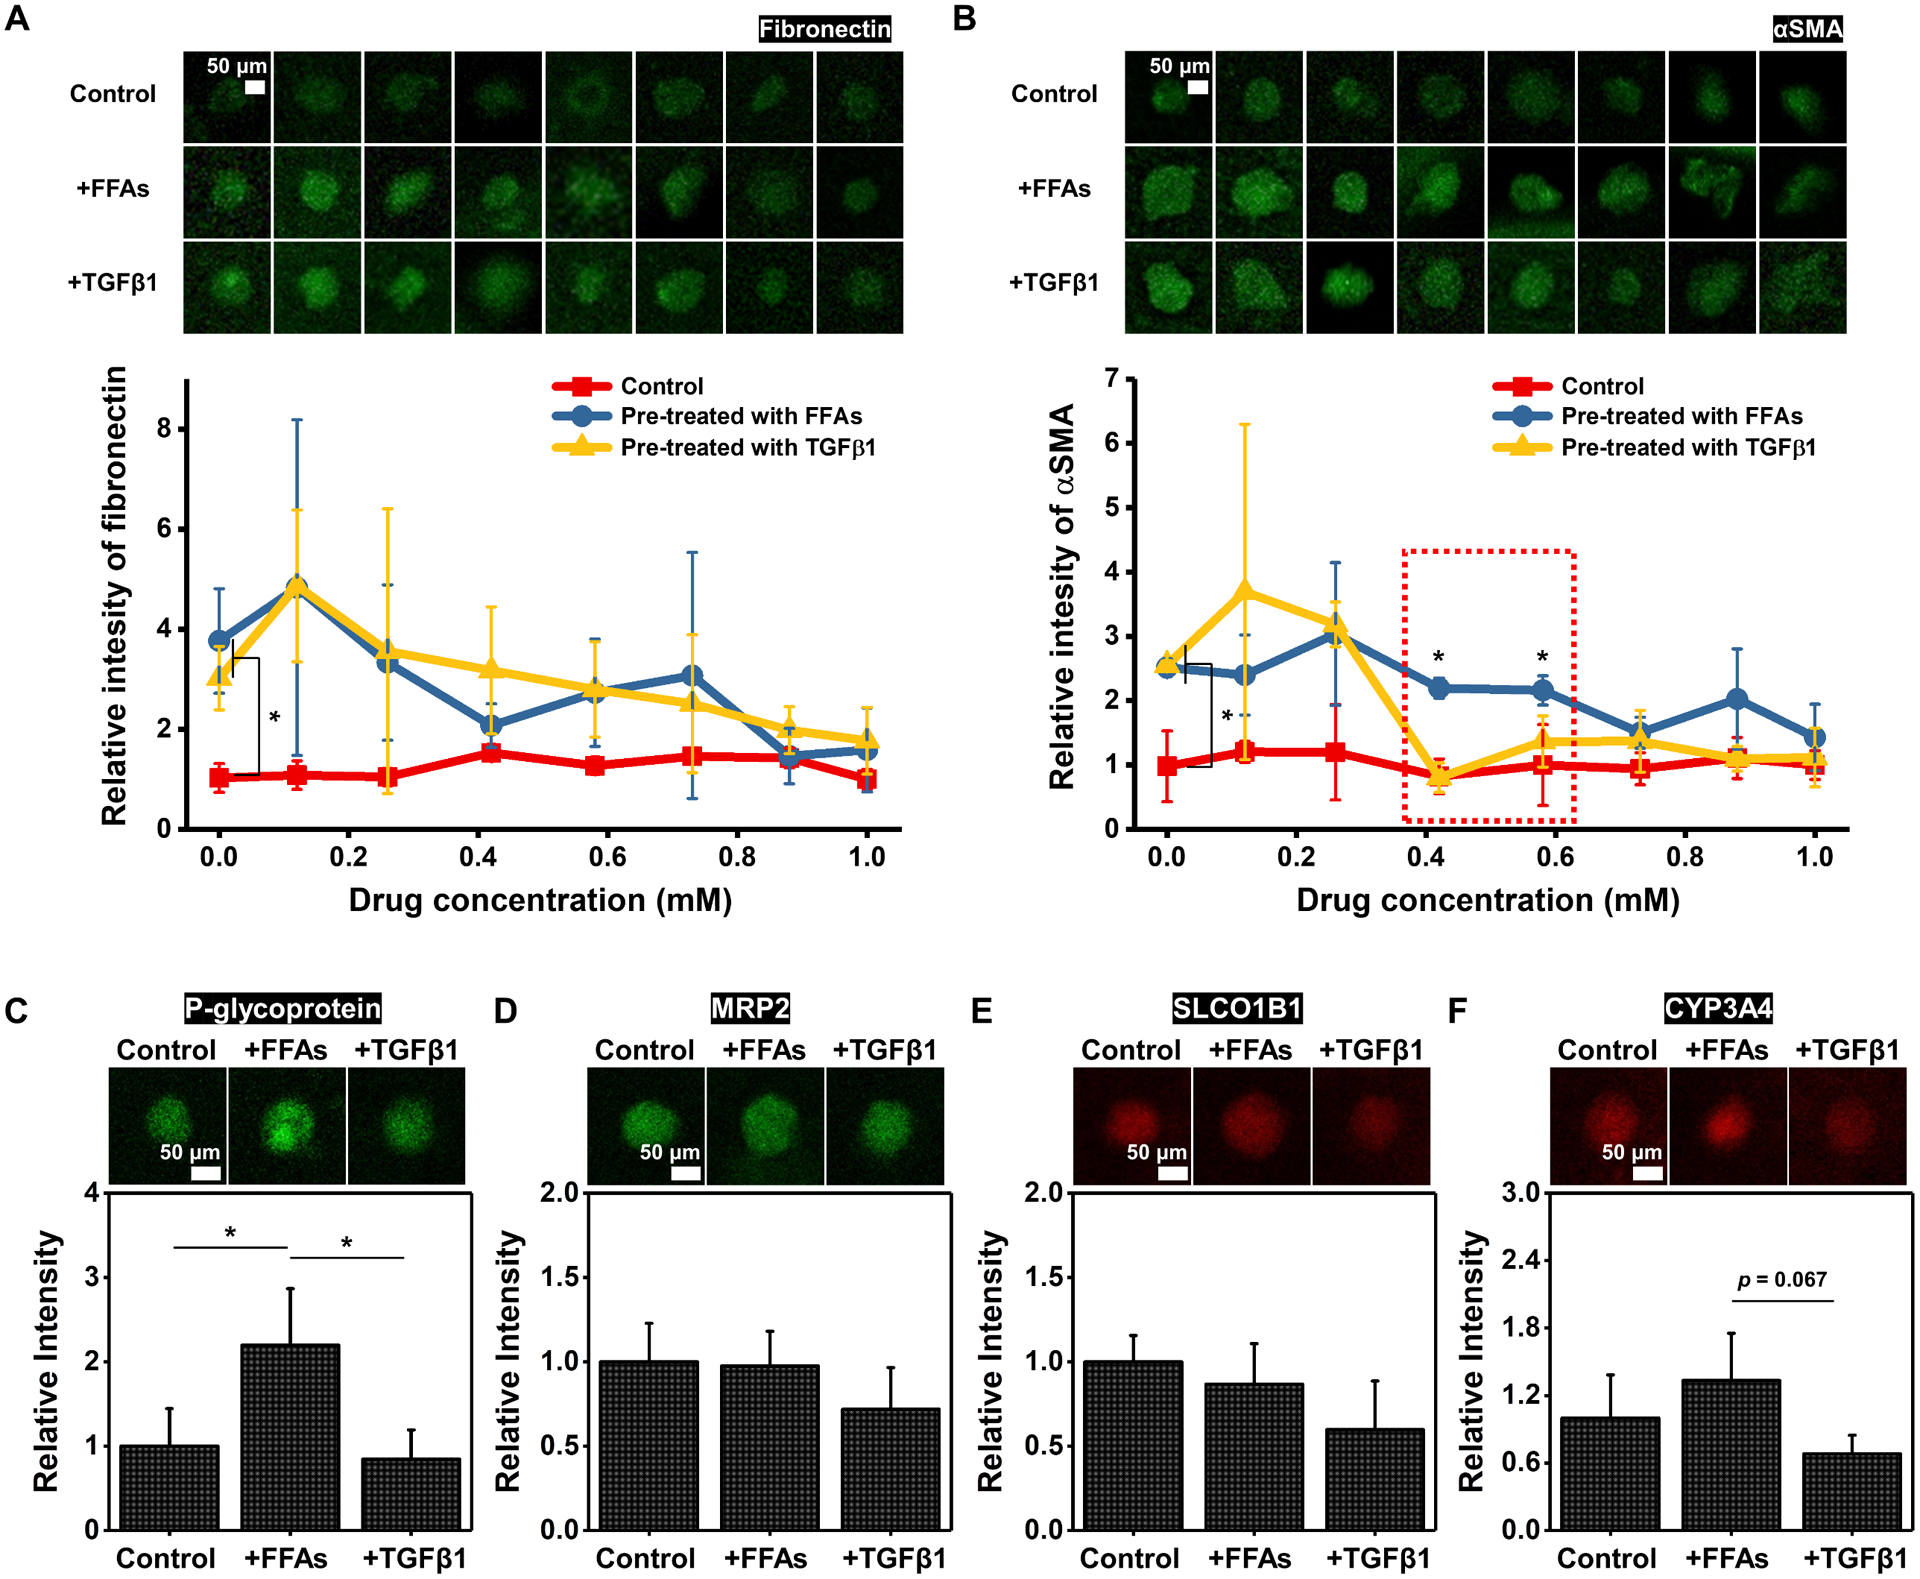
Figure 4. Drug screening and drug transporters/enzymes identification tests in the microfluidics-assisted liver-on-a-chip system.

Representative confocal images and relative intensity of A) fibronectin and B) αSMA expression levels for control and groups pre-treated with FFAs or TGFβ1 after culturing them with different concentrations of pirfenidone in microfluidic devices (n = 3). The relative ratio of the control group is set as 1, and those of other groups are presented. The relative intensity of C) P-glycoprotein, D) MRP2, E) SLCO1B1, and F) CYP3A4 in control, FFAs-treated, and TGFβ1-treated groups on day 21 (n = 3). The relative intensity of the control group is set as 1, and relative ratios of those in FFAs-treated and TGFβ1-treated groups are calculated. Error bars indicate standard deviation. ANOVA, *P < 0.05, between specified groups.
