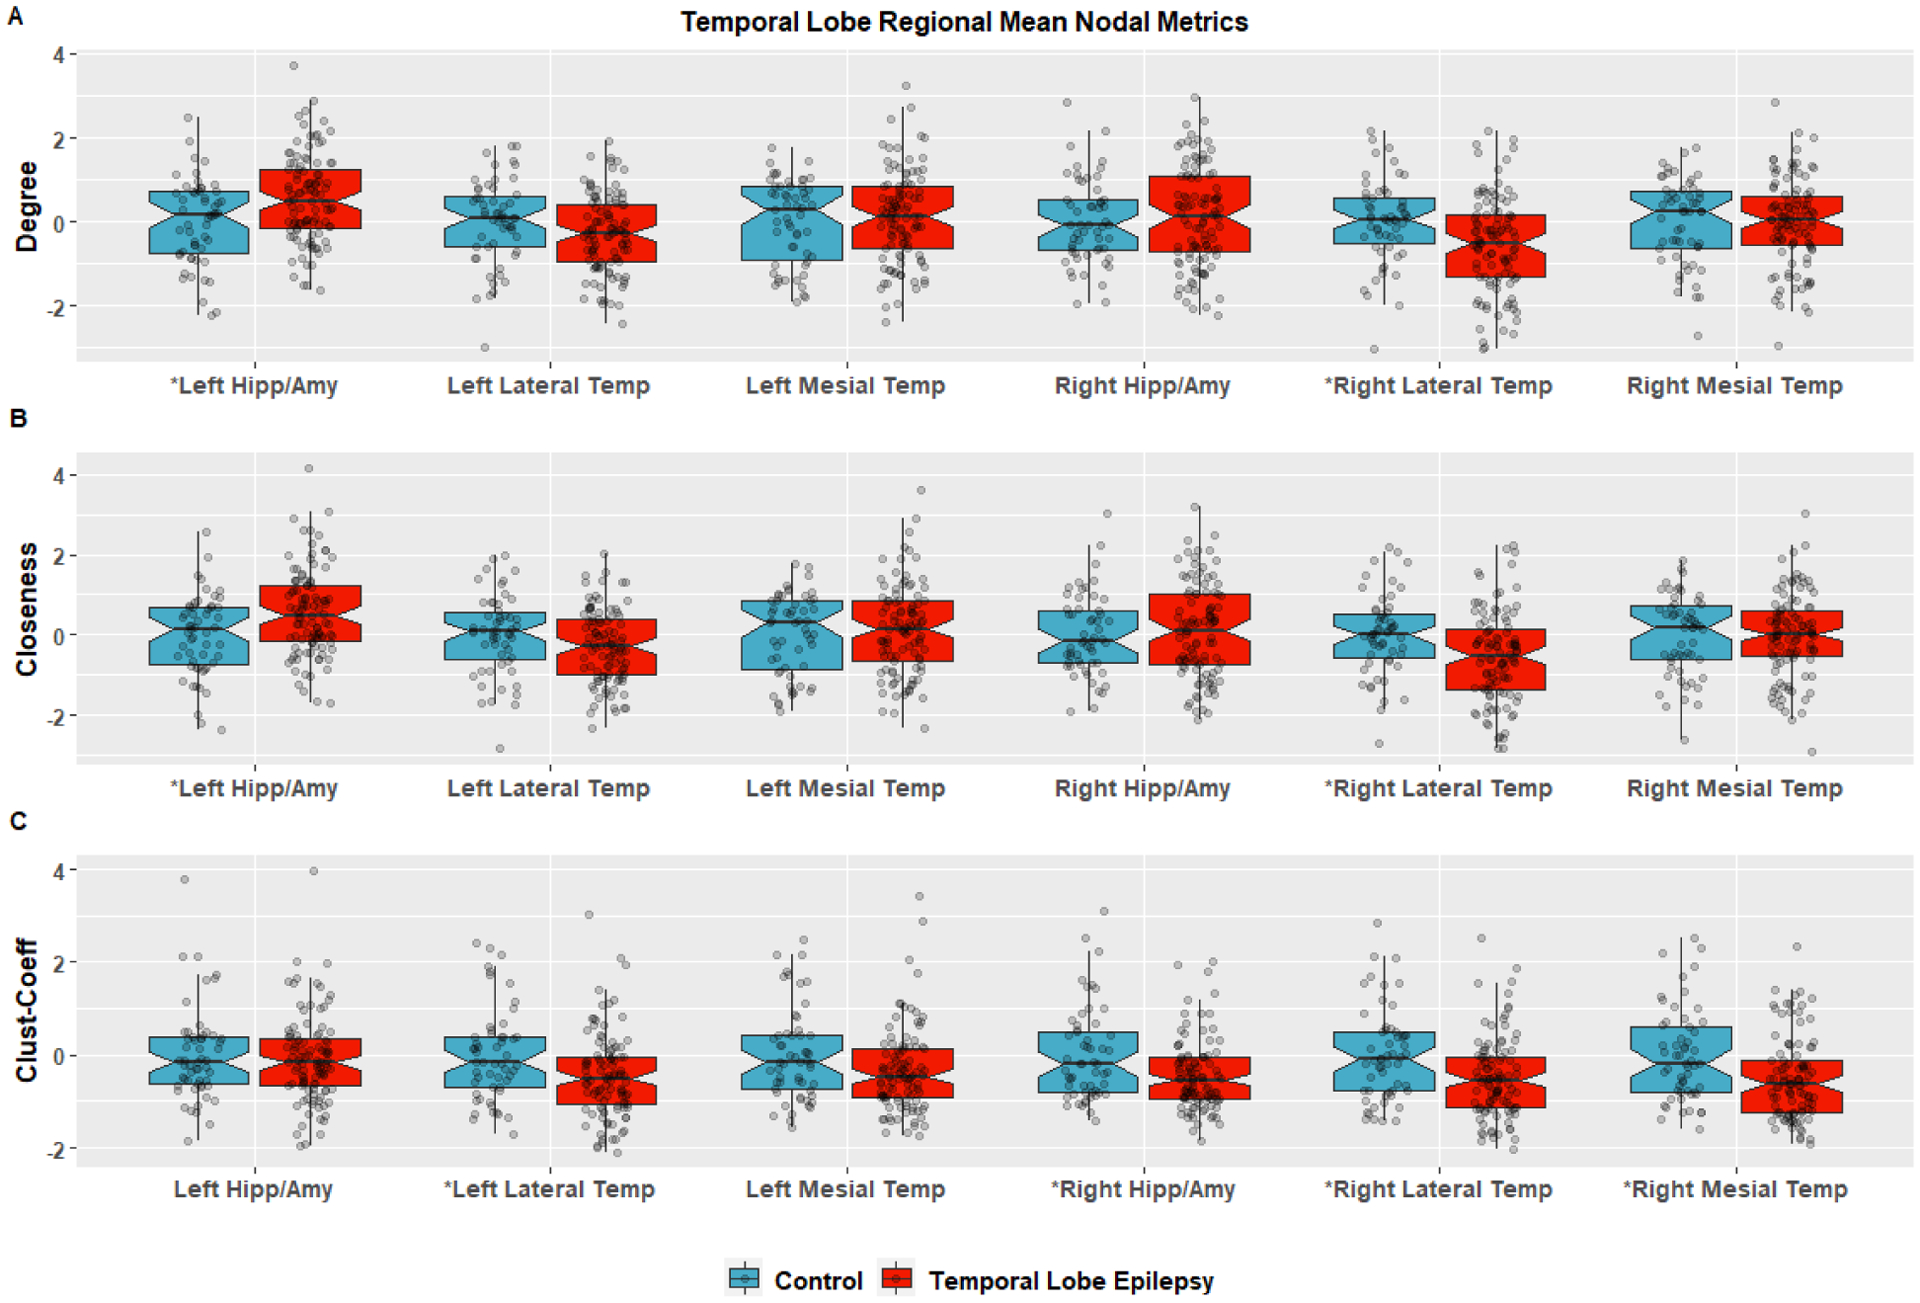
Figure 4:

Regional graph theory metrics are the mean of the nodal metrics for that region specified by the Glasser et al parcellation/network scheme[34] for the Lateral Temporal the Mesial Temporal Lobes. These are regions based on surface vertices, which are limited in their ability to map connectivity for subcortical regions so the amygdala and hippocampal region is volumetric and based of freesurfer segmentation. The mean regional Degree is in plot (A), Closeness is (B) and the regional Clustering Coefficient is in plot (c). The data is scaled by the control mean and standard deviation for ease of visual comparison. Group comparisons were performed with two-sided permutation testing FDR correction and those with an *were significant for (A) Degree for left hippocampus/amygdala (p=0.0103), right lateral temporal (p=0.0186) and for Closeness (B) left amygdala/hippocampus (p=0.0104) and Right lateral temporal lobe (p=0.0122). Other regions did not have a statistical difference for closeness or degree. For regional Clustering Coefficient (C) there was a decrease in TLE versus control for the left lateral temporal (p=0.0363), right amygdala/hippocampus (p=0.0141), right medial temporal (p=0.00930), and right lateral temporal (p=0.0122).
